Introduction and Basic Configuration - Article
Summary
This article introduces the Analytics framework in Eurekos and explains how dashboards, permissions, and report templates work together to transform platform data into actionable operational and strategic insight.
In this article you will learn:
- How the Analytics framework transforms learning data into operational insight
- How dashboards, permissions, and report templates structure reporting
- How analytics supports both daily operations and strategic decision-making
- How analytics governance ensures secure and scalable reporting
Analytics & Reporting: From Operational Insight to Strategic Intelligence
Analytics in Eurekos is designed to help organizations move beyond static reporting and isolated metrics toward a holistic, meta-level understanding of learning impact. This has evolved into a powerful analytics layer that turns user activity into actionable intelligence—supporting both day-to-day operational management and long-term strategic decision-making.
At its core, Analytics is built around a meta-analytics engine. Rather than forcing organizations to stitch together dozens of narrow reports, the platform aggregates learning data across users, content, organizations, commerce, and engagement into a coherent analytical model. This reflects our core philosophy and the result is an analytics experience that can provide answers not only what happened, but also why it matters—and what to do next.
Why Analytics in Eurekos Is Different
Traditionally reporting often focuses on isolated outputs such as completions, attendance, or certificates. While necessary, these metrics alone rarely tell the full story. Our analytics strive to operate at multiple levels simultaneously and over time evolved with our customers to provide:
- Operational level – Supporting administrators, instructors, and managers with real-time insight into enrollments, attendance, progress, certifications, and transactions
- Program level – Helping learning owners understand adoption, engagement, conversion, and performance across courses, subscriptions, and learning pathways
- Organizational level – Enabling leadership to assess learning effectiveness across regions, customer segments, partners, or internal teams
- Strategic (meta) level – Revealing patterns over time that inform portfolio design, commercial strategy, compliance coverage, and investment decisions
This layered approach means our native Analytics delivers what most organizations need out of the box, without requiring complex BI projects—while still allowing advanced or specialized use cases to be handled externally when required.
Designed for Real-World Decision-Making
Analytics combines visual charts, filterable datasets, and exportable reports to support different decision-makers across the organization:
- Administrators gain clarity on platform usage, data quality, and operational health
- Managers and instructors track participation, performance, and learner progress
- Commercial and customer education teams monitor conversions, invitations, and revenue-related metrics
- Executives and auditors access high-level indicators for compliance, adoption, and business value
Charts present live data visually, while templates and exports ensure consistency for recurring analysis, audits, or stakeholder reporting. Together, they transform data into a shared source of truth.
Meta-Level Analytics with Flexibility for Advanced Needs
A key principle is pragmatism. The platform is intentionally designed to cover the vast majority of analytics needs internally—at speed, with clarity, and without unnecessary complexity.
That said, this does not lock organizations in.
For advanced scenarios—such as enterprise-wide BI consolidation, cross-system correlation, or custom data science initiatives—organizations can:
- Export reports in structured formats
- Use analytics templates as standardized data definitions
- Extend analytics beyond the platform by integrating Eurekos data with external BI tools through the API, or by connecting third-party Learning Record Stores (LRS) to collect granular xAPI data at the learning-object level
- Combine LMS data with CRM, ERP, or financial systems where needed
This ensures analytics scales with organizational maturity: start with built-in insight, extend when necessary.
Ultimately, analytics is not just about measurement—it’s about learning optimization. The LMS evolves from a delivery system into a decision-support platform—providing the clarity needed to improve learning outcomes, business performance, and long-term impact.
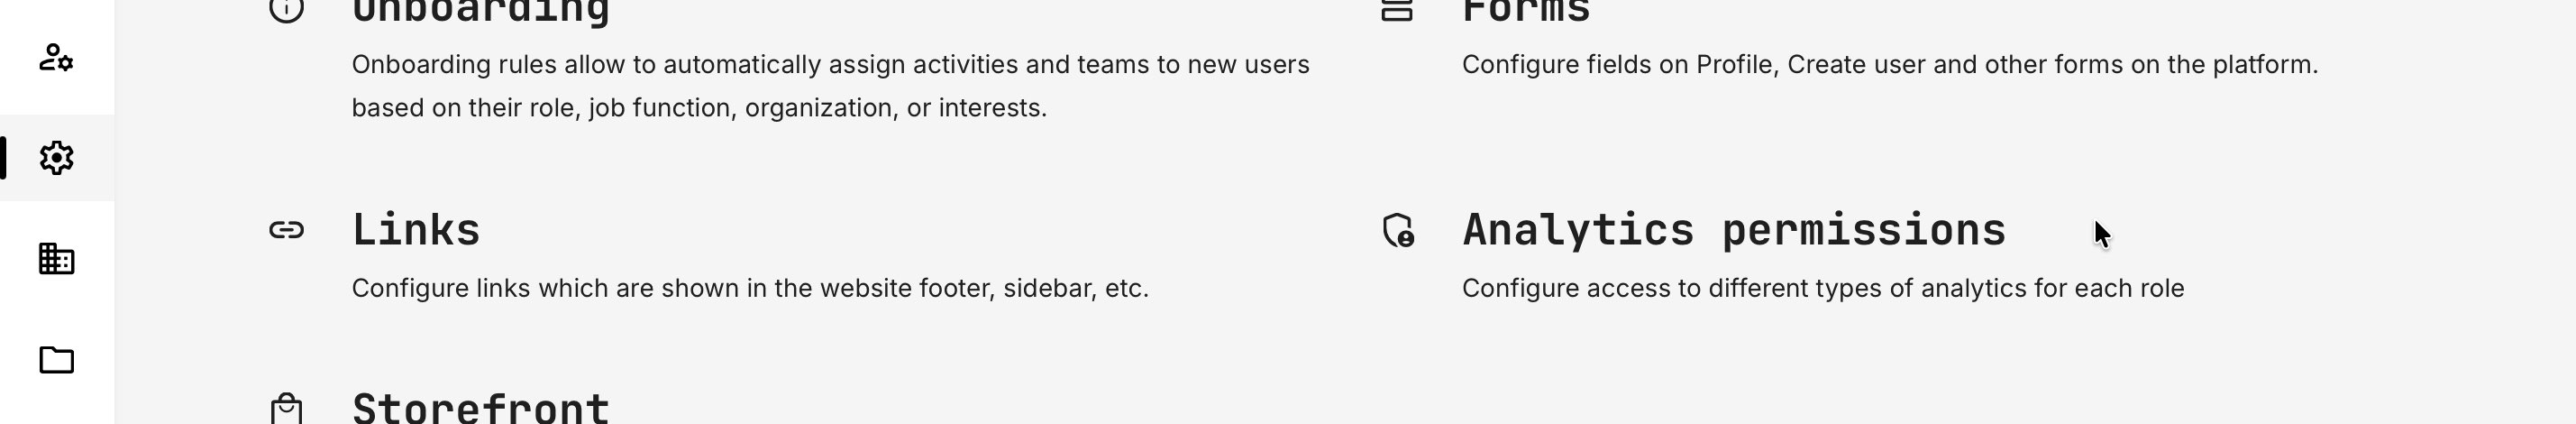
Configure Access Permissions and Roles
Access to Analytics and system reports is managed centrally by Platform Administrators and can be configured per role at the platform level. This ensures that each role only sees the data relevant to its responsibilities—ranging from high-level insights for managers and auditors to detailed operational reports for administrators—while maintaining governance, data security, and compliance across the platform.
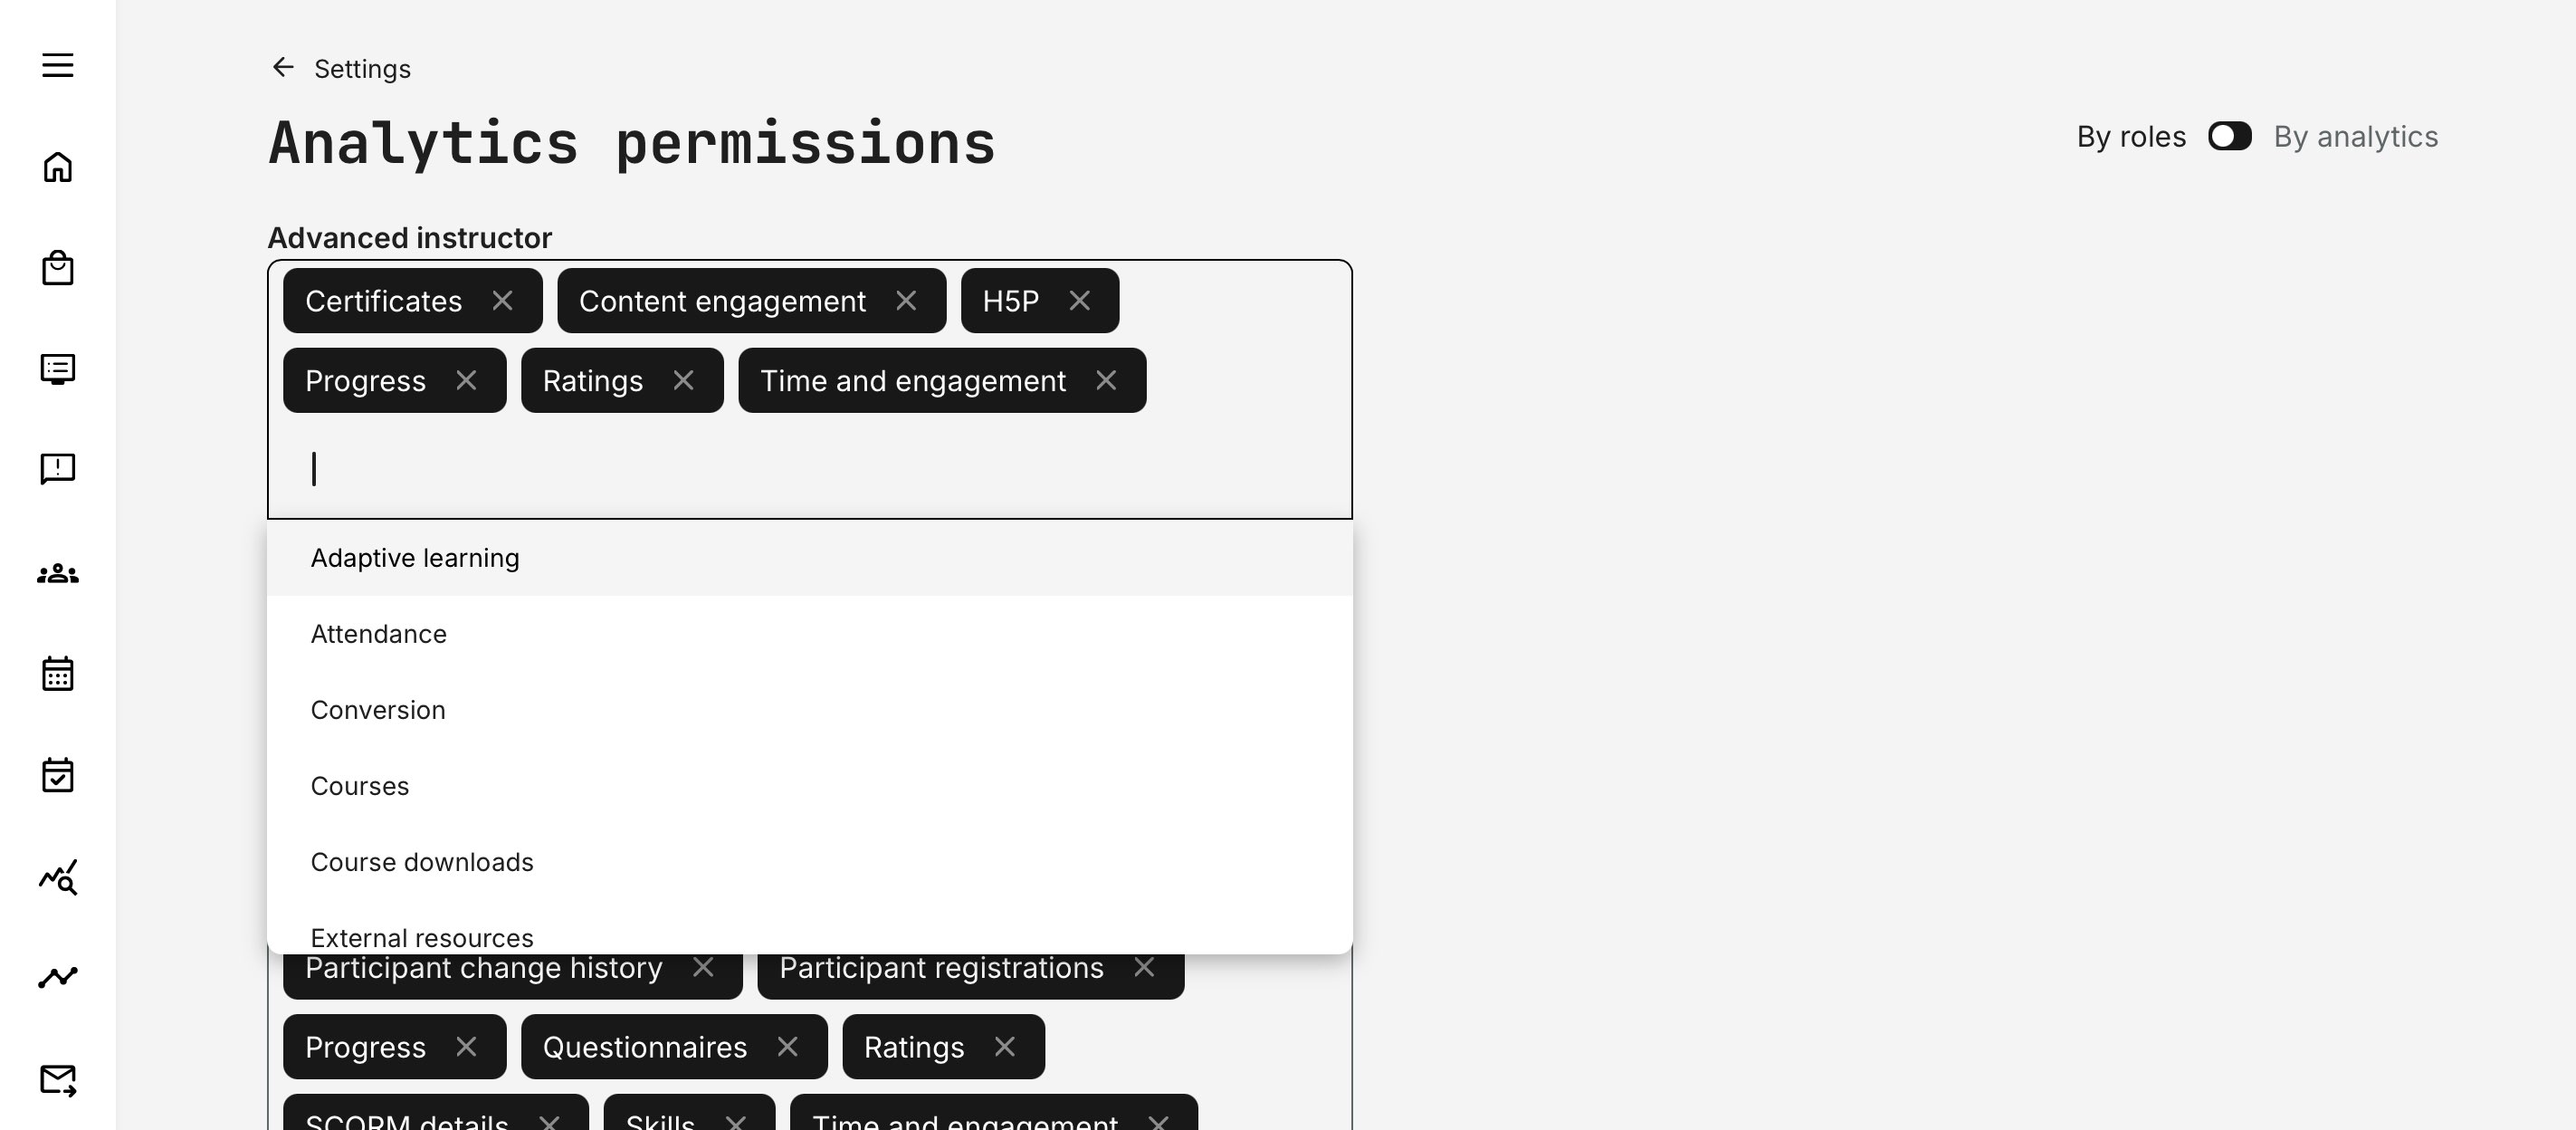
Some roles may require more granular or specific access to certain data types, whereas others require a broad scope without too many details. Whatever their requirements, they can be set up and adjusted in Settings → Analytics permissions.
When you open the Analytics Permissions page, you’ll see an overview listing all roles enabled on your platform, each with a corresponding permissions field. Selecting a role opens a drop-down menu where you can assign specific Analytics permissions—such as access to individual reports or dashboards—to that role.
If you prefer to configure access from the opposite perspective, you can use the toggle in the top-right corner to switch between managing permissions by role or by analytics item, depending on how you prefer to work.
Once you’ve assigned the desired permissions, scroll to the bottom of the page and click [Save] to apply your changes.
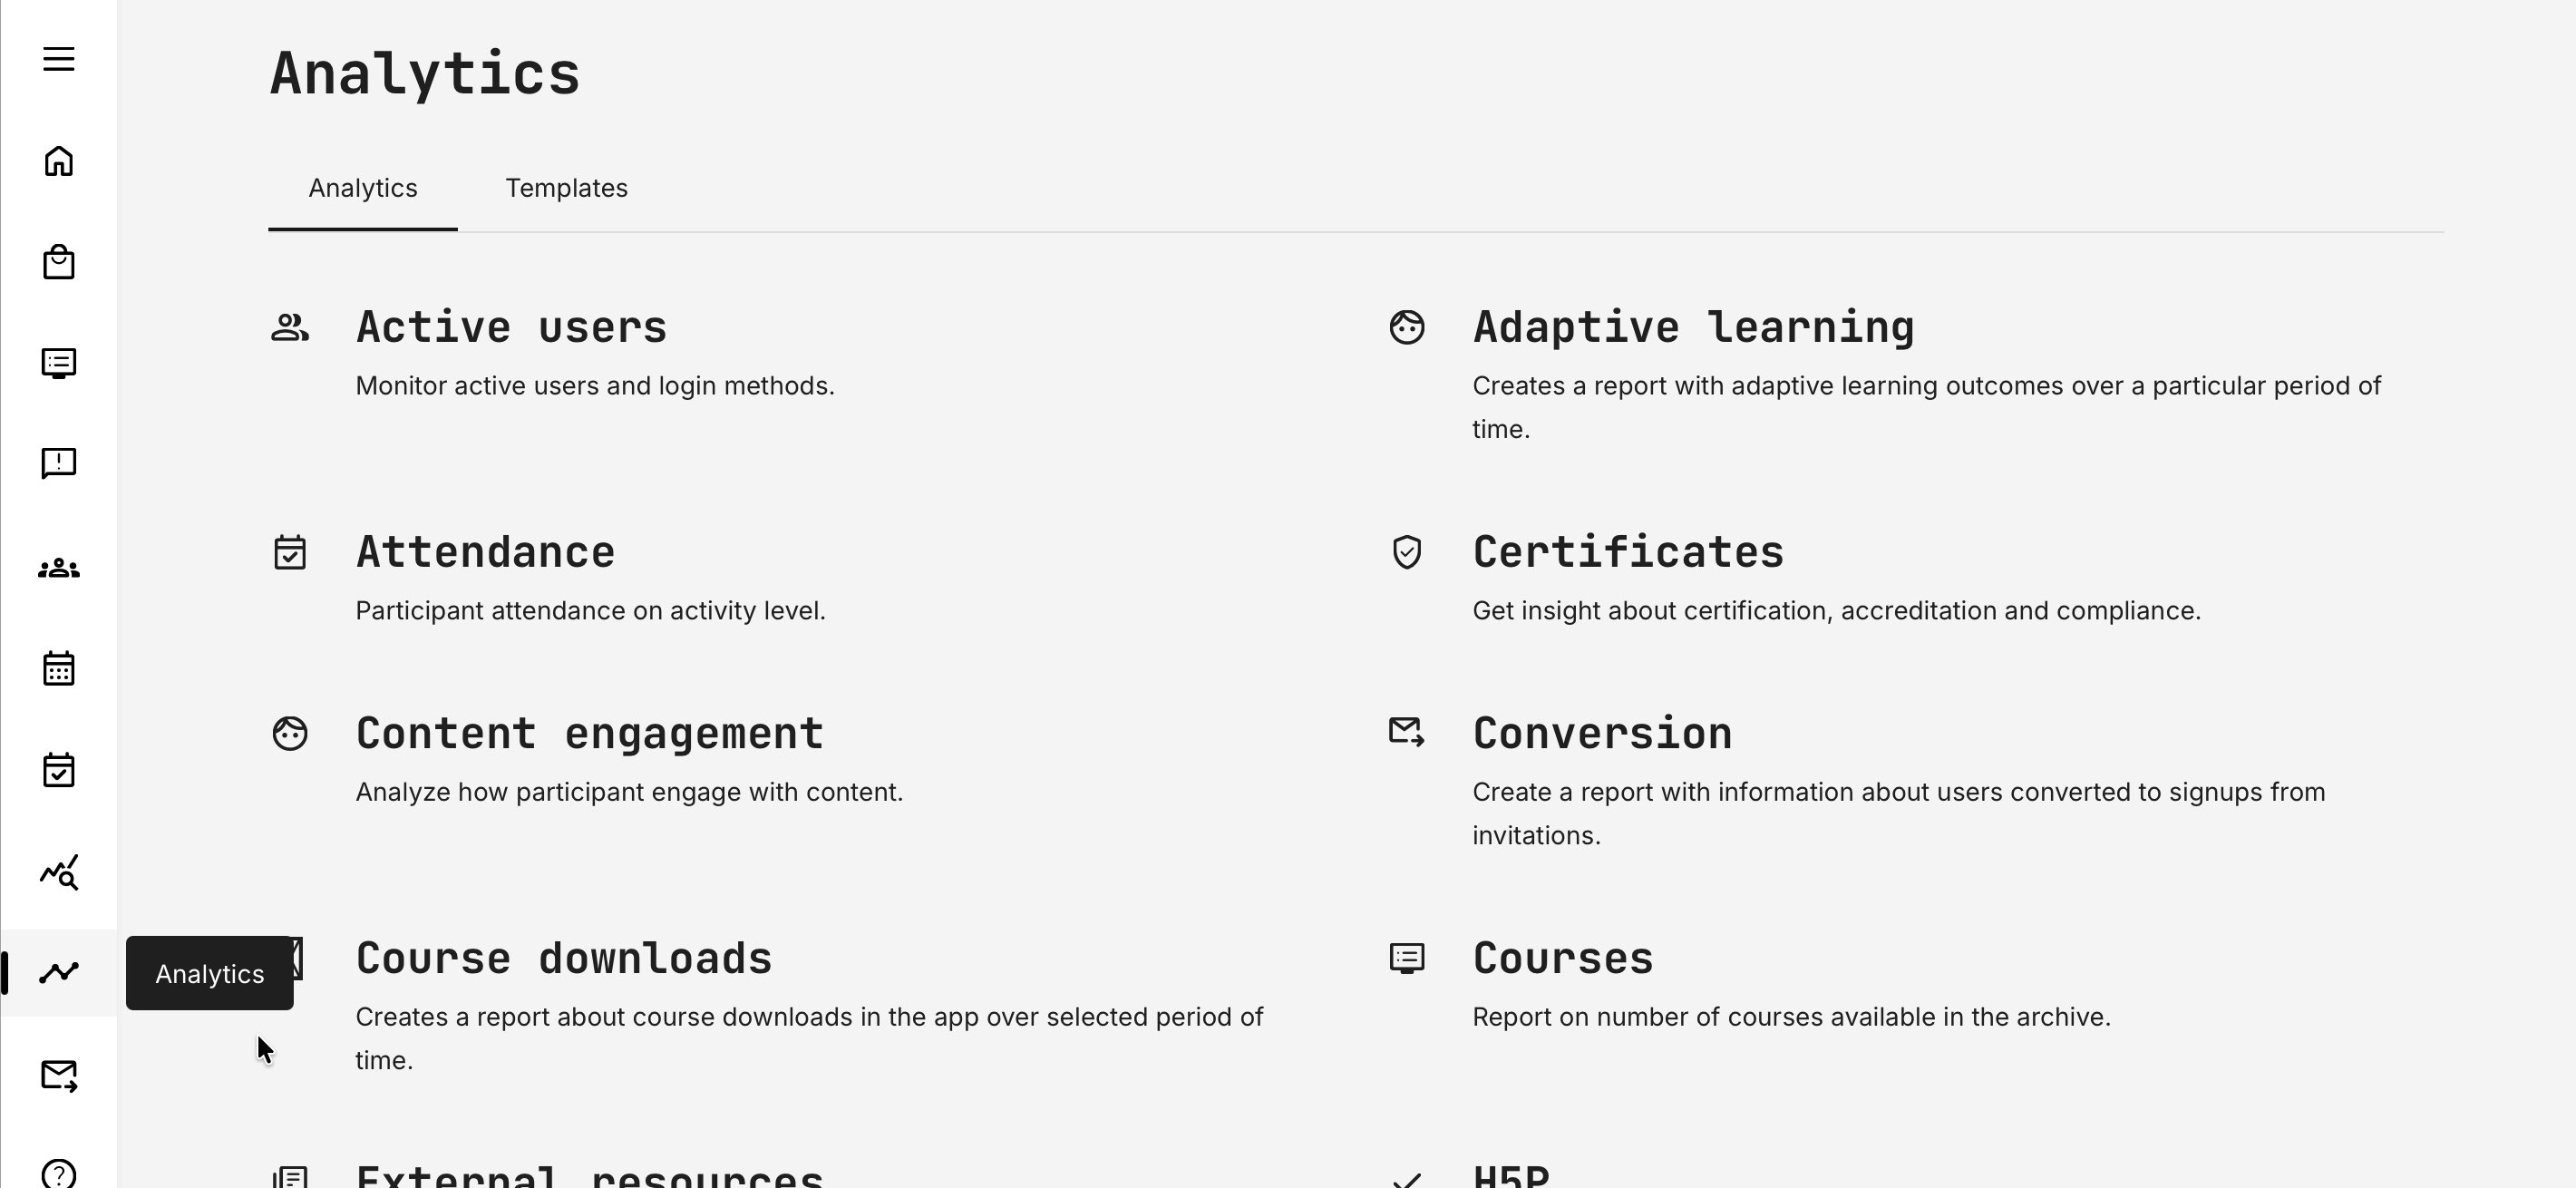
Once the configuration is saved, users in the assigned roles will gain access to the Analytics features allocated to them. Each Analytics area is described in detail in its own dedicated article. For all users with Analytics access, the entry point is the [Analytics] menu item in the main navigation.
Analytics and Report Templates
Analytics report templates make it easy to create consistent, reusable reports across your platform. Instead of rebuilding the same reports repeatedly, you can define templates that control which data is included, how reports are structured, and who can access them.
Templates help ensure that different teams see the right data—without exposing unnecessary details—and that reports remain aligned with business needs. Not everyone needs the same level of access. Eurekos allows report templates to be managed centrally while still giving selected roles flexibility.
- Administrators (Platform, Global, or Affiliate Admins) can create, manage, and assign templates across the platform
- Course Administrators and Auditors can create and manage their own templates for the areas they are responsible for
- Managers, instructors, and other roles can use approved templates to generate reports but cannot change their structure
This ensures reporting stays governed, consistent, and easy to maintain.
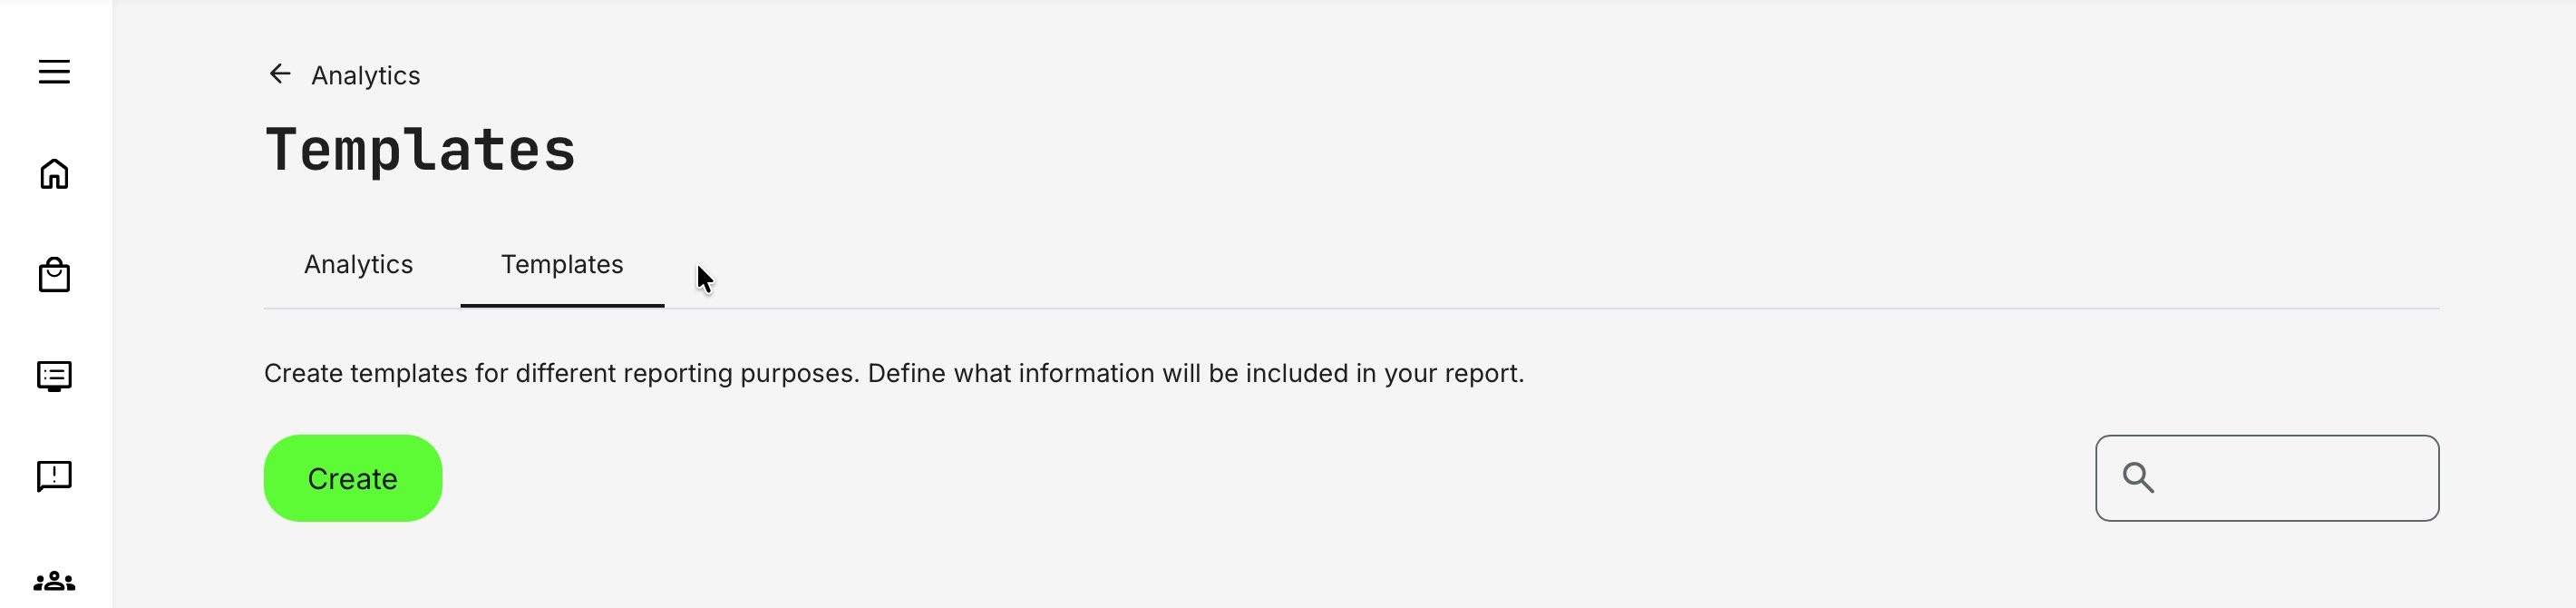
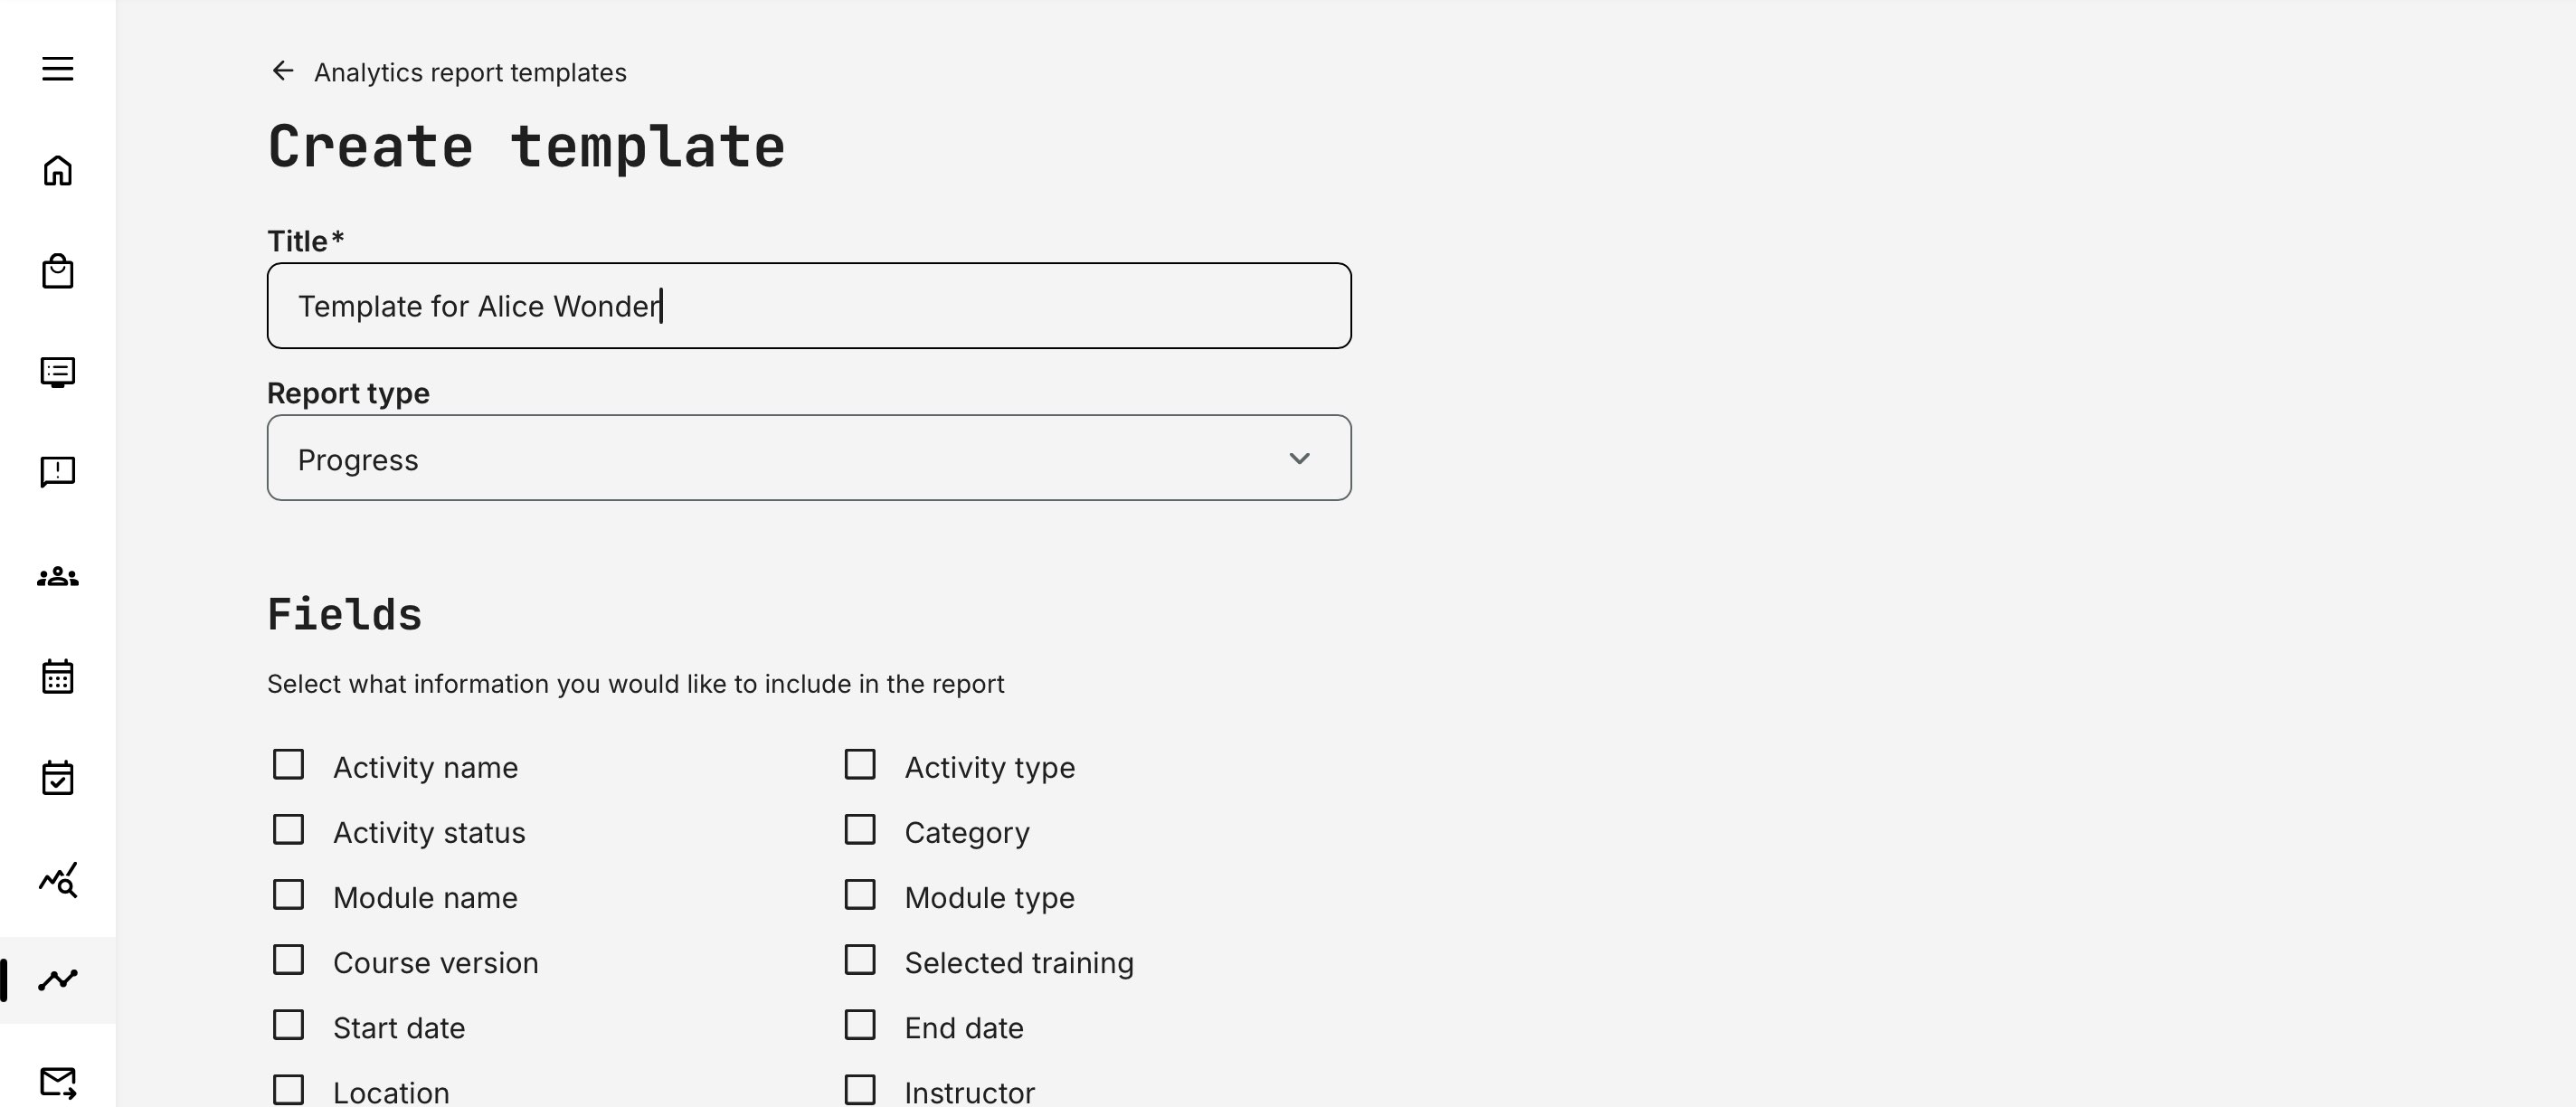
To create a report template, go to Analytics → Templates (tab) and click [Create] to get started.
Report templates make it easy to standardize analytics while still ensuring the right people have access to the right data. The creation process is intentionally simple and designed to scale.
- You begin by giving the report a clear, descriptive title so its purpose is easy to understand and easy to find later—especially as your library of templates grows
- Next, you select the report type. This choice determines which data sources and fields are available, ensuring the template is built on the correct dataset
Now, you select the specific fields to include in the report, tailoring it to the needs of its intended audience. Some report types offer only a small set of focused data points, while others expose dozens of available fields—reflecting the complexity and depth of the underlying topic. This allows you to keep reports concise where needed, or richly detailed when deeper insight is required.
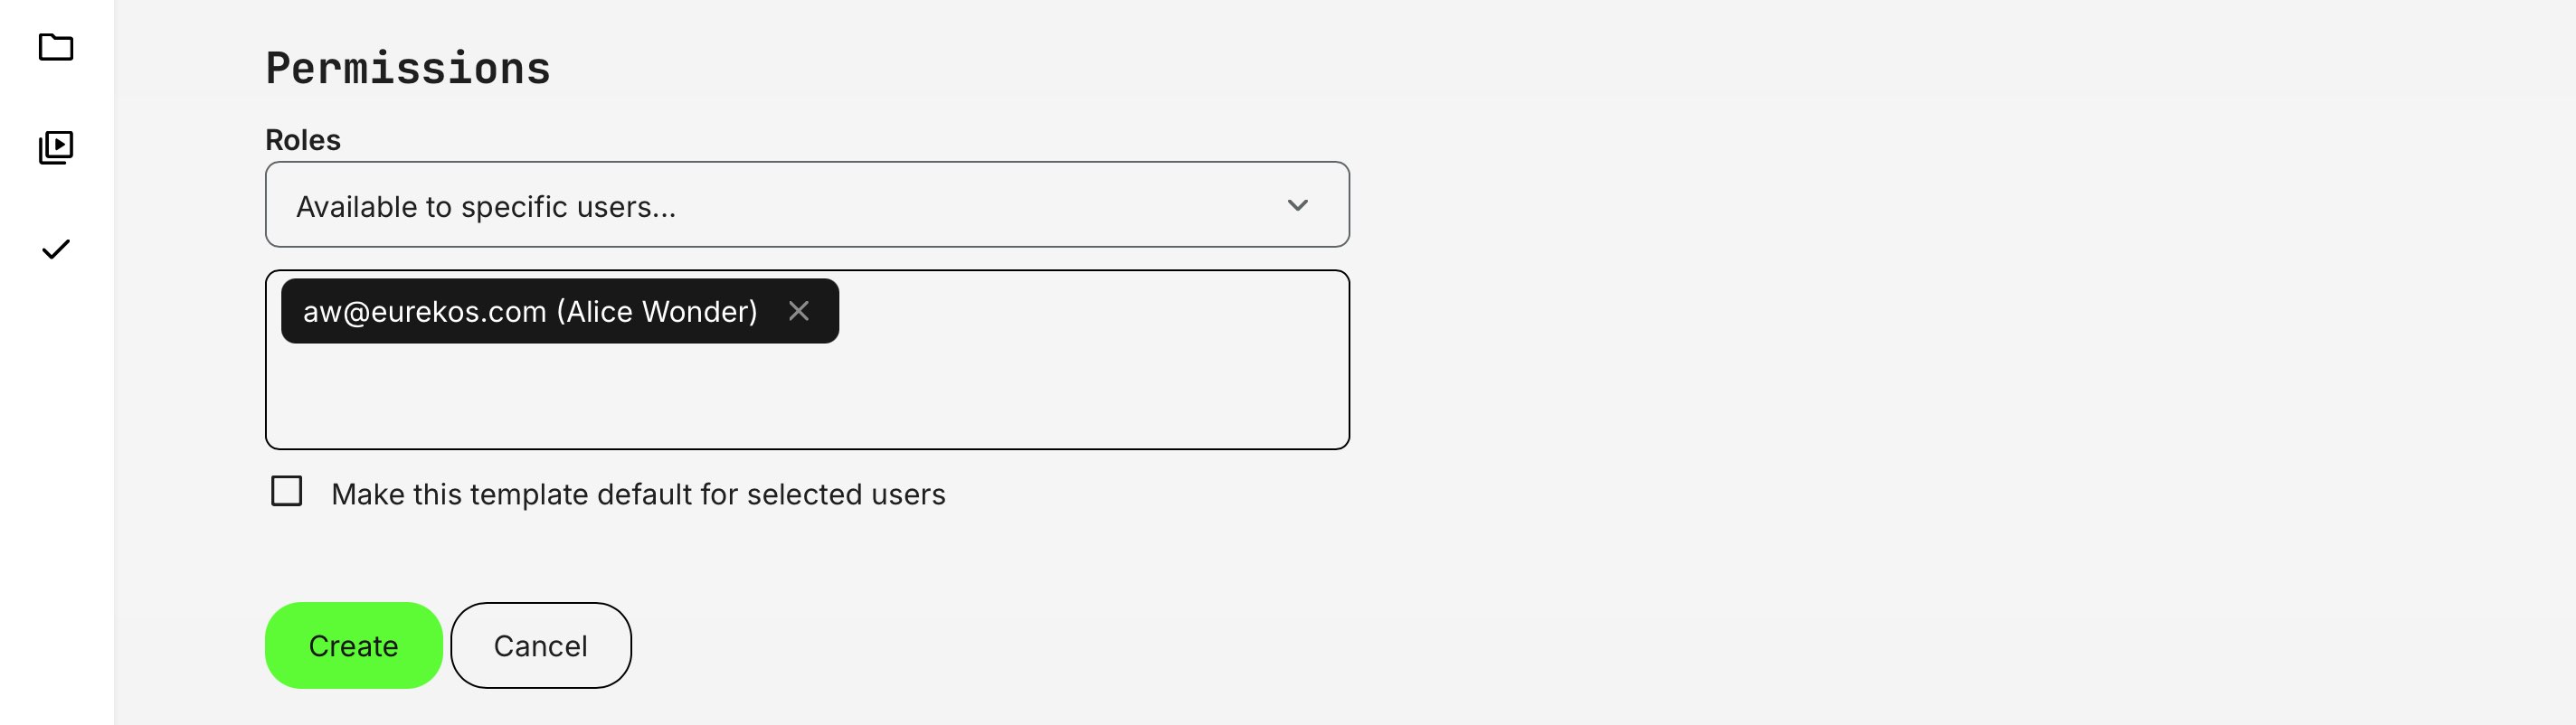
Finally, you define who can use the template by assigning access to specific roles or individual users. You can also mark the template as the default for the selected roles or users, so it is automatically preselected when they generate a report of that type. Only one template can be set as the default per role or user.
Once saved, the template becomes immediately available for generating reports, helping to ensure consistency and saves time for frequent reporting.
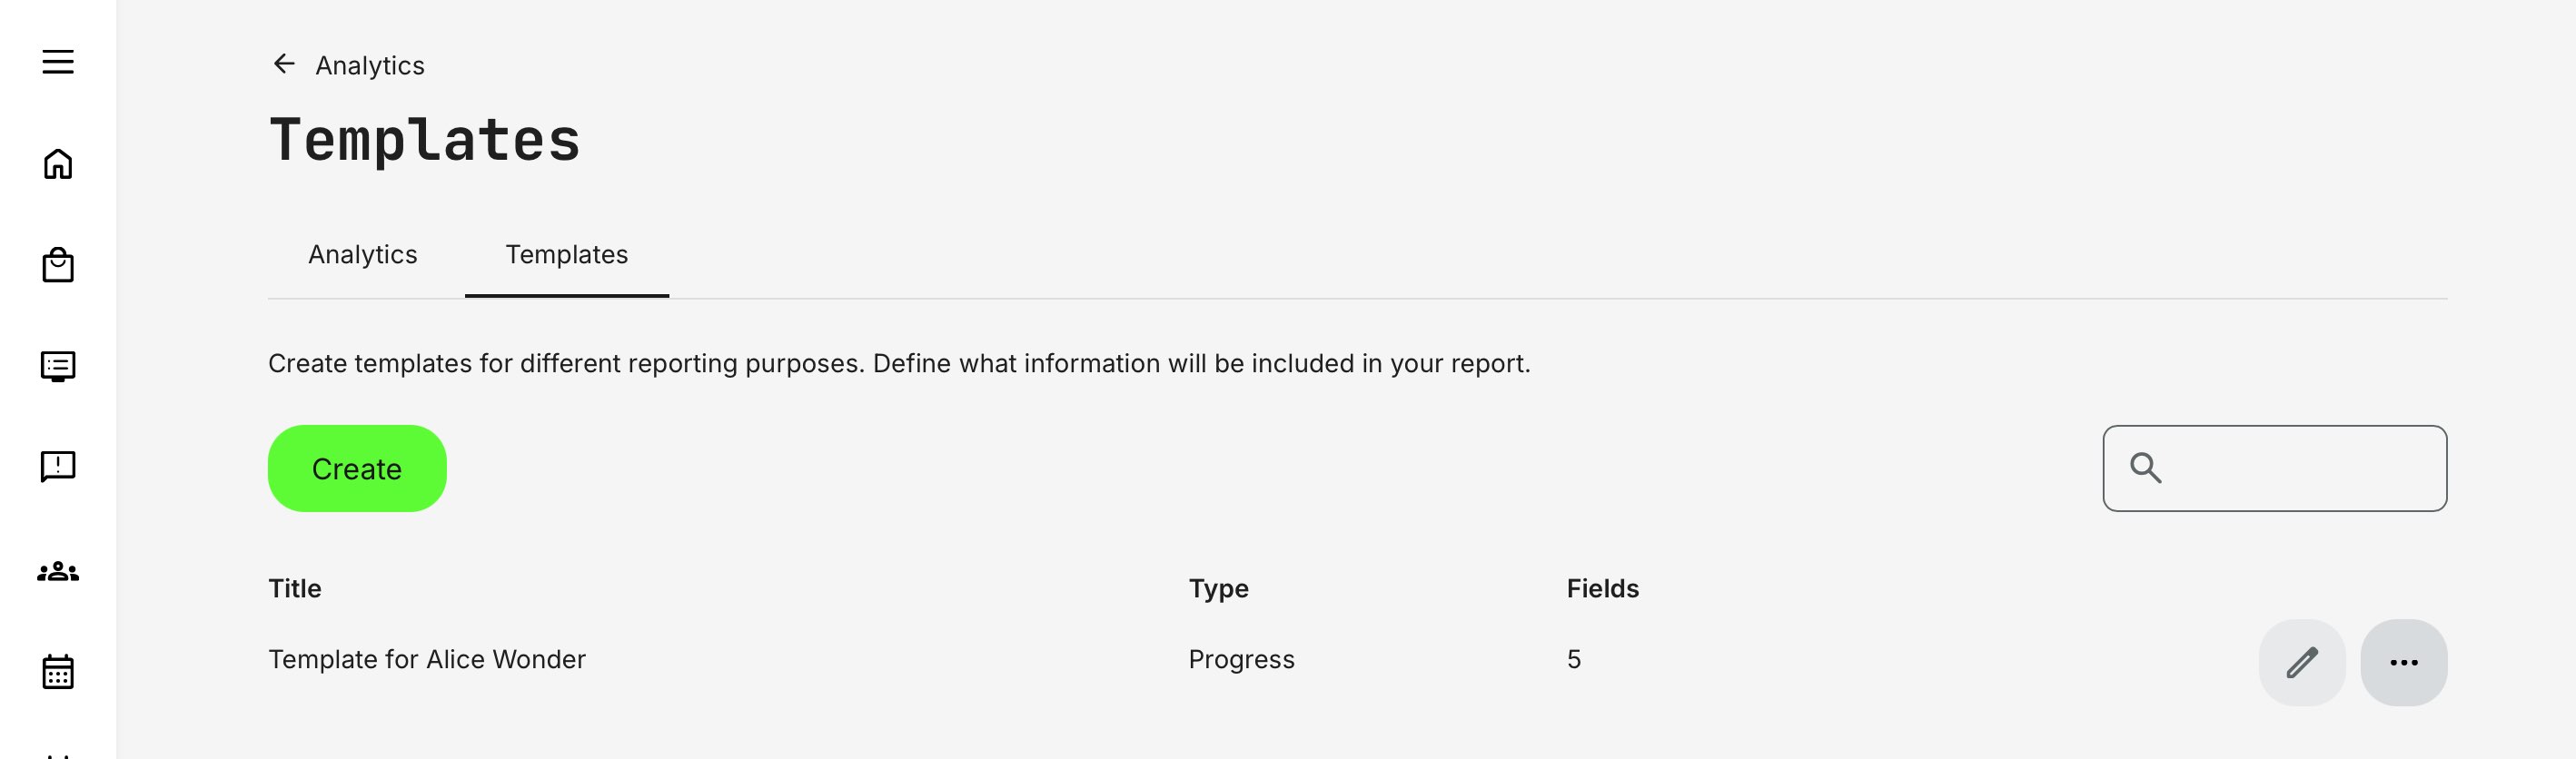
Once created, templates appear in the overview, displaying the report title, report type, and the number of data fields included. This is why clear, descriptive titles are important—especially as the number of custom templates grows. From the overview, you can use the [Edit] (pen) icon or the [More] (ellipsis) menu to update, adjust, or delete existing report templates as needed.
Restrict through customization: Roles that are not permitted to customize reports cannot download a full report when one or more report templates are available to them. In these cases, users can only generate reports using the predefined templates they have access to.
If no report templates are available for a given report type, the full report will be downloaded by default. This behavior applies consistently to all reports that support report templates, ensuring controlled access to data while still providing flexibility when no templates are defined.
This use case is particularly designed to support common business requirements for roles such as Manager, Immediate Manager, Instructor, and Advanced Instructor.
Permissions, Data Access, and Organization Layer
Access to analytics views and reports in Eurekos is governed by role-based permissions and the organization layer. Together, these ensure that users only see data they are authorized to access, while preserving accurate aggregation and long-term auditability.
Key principles apply across reports and analytics:
- Role-based access: Visibility depends on the user’s role (e.g. Administrator, Course Administrator, Instructor, Manager, Partner). Each role determines which activities, participants, and data dimensions are available
- Organization-layer scoping: Users see data only for organizations they are assigned to
- Higher-level organizations can see data from sub-organizations
- Lower-level organizations cannot see data from parent or sibling organizations
- Partner roles are restricted to their own organization
- Consistent user-status handling
- Blocked users are included to preserve historical accuracy
- Deleted users are excluded to support privacy and compliance requirements
- Cancelled and expired enrollments are included, ensuring full visibility into participation and change history
- Historical integrity: Deleted activities or organizations may remain visible (marked as [DELETED]) where required to preserve reporting continuity, audit trails, and trend analysis
- Permission-aligned analytics and reports: Analytics dashboards and downloadable reports follow the same access rules, ensuring consistent governance between on-screen insights and exported data
This model ensures that all reporting remains secure, context-aware, audit-ready, and aligned with organizational governance — without fragmenting data across roles or reports.
Analytics & Reports — How to Choose the Right One
Eurekos provides a broad set of analytics dashboards and reports because different questions require different lenses. Some views are designed for real-time supervision and decision-making, while others exist to provide exportable, audit-ready evidence or deep forensic insight.
As a rule of thumb:
- Analytics answer: “What is happening right now, and how is it trending?”
- Reports answer: “Exactly who did what, when, and under which conditions?”
Used together, analytics and reports give you both situational awareness and formal documentation—from daily operations to compliance and executive reporting.
| Area | Analytics | Report | When to Use It |
|---|---|---|---|
| Progress | ✔︎ | ✔︎ | Use Analytics for real-time supervision of progress and completion. Use the Report for audit-ready exports, documentation, and external reporting. |
| Learning Performance | ✔︎ | Use to monitor certification status, overdue training, and re-certification readiness across users or activities in a single visual dashboard. | |
| Certificates | ✔︎ | ✔︎ | Use Analytics to monitor issuance, expirations, and trends. Use the Report to document who earned which certificate and when. |
| Attendance | ✔︎ | Use to prove participation, support audits, and validate eligibility for certificates or credits. | |
| Participant Registrations | ✔︎ | Use to manage logistics, planning, and follow-up before, during, and after training delivery. | |
| Participant Change History | ✔︎ | Use to trace enrollment changes over time and maintain an audit trail of participant status changes. | |
| Content Engagement | ✔︎ | Use to analyze how pages, videos, H5P objects, and other content are actually consumed and revisited. | |
| Time & Engagement | ✔︎ | Use to benchmark learning effort across organizations, partners, or programs and correlate time investment with outcomes. | |
| Ratings | ✔︎ | ✔︎ | Use Analytics to assess overall sentiment and trends. Use the Report for detailed review data and governance purposes. |
| Questionnaires | ✔︎ | ✔︎ | Use Analytics to understand response rates and patterns. Use the Report for respondent-level answers, audits, and follow-up. |
| H5P Question Set | ✔︎ | Use to analyze detailed assessment responses across activities, programs, or regions in one consolidated export. | |
| SCORM Details | ✔︎ | Use to review completion, scores, attempts, and question-level data from SCORM-based content. | |
| Course Downloads (Mobile / Offline) | ✔︎ | Use to understand which courses and pages are downloaded and consumed offline, especially by region or audience. | |
| Courses (Library Growth) | ✔︎ | Use to track course creation volume, authoring activity, and quarterly content production. | |
| External Resources | ✔︎ | Use to identify and maintain external links embedded across courses and activities. | |
| Active Users | ✔︎ | ✔︎ | Use Analytics to monitor platform usage trends. Use the Report for license validation and login forensics. |
| Conversion | ✔︎ | Use to measure the effectiveness of invitations, promotions, and outreach campaigns. | |
| Transactions | ✔︎ | Use to reconcile enrollments, invoicing, subscriptions, and commercial agreements. | |
| Market Value | ✔︎ | Use to demonstrate the estimated business value delivered by training—especially for free or strategic programs. | |
| Skills | ✔︎ | Use to document skill achievement, levels, expirations, and alternative accreditation models. | |
| Legal Documents | ✔︎ | Use to prove acceptance of privacy policies and regulatory consents for audits and compliance frameworks. |
Common Usage Patterns
- Managers & Supervisors: Use Learning Performance, Progress, and Time & Engagement Analytics to prioritize follow-up and ensure readiness
- Compliance & Governance Teams: Rely on Certificates, Attendance, Legal Documents, and Progress Reports for audit trails and regulatory evidence
- Learning Designers & Academies: Combine Content Engagement, Adaptive Learning, Ratings, and Questionnaires Analytics to improve learning quality and outcomes
- Commercial & Partner Teams: Use Transactions, Market Value, Conversion, and Certificates Analytics to demonstrate ROI, partner readiness, and business impact
- Administrators & Operations: Use Participant Registrations, Change History, External Resources, and Courses Reports to maintain operational control and data integrity and all the above ad hoc
No single report tells the full story. The strongest insights emerge when you layer perspectives: Engagement → Progress → Completion → Certification → Time → Value. Applied together, they support operational excellence, compliance confidence, and provide critical input for strategic decision-making.