Ratings Analytics and Reports - Article
Summary
Ratings analytics and reports show how learners rate training activities on a 1–5 scale. They provide visual sentiment trends and exportable evidence to help administrators monitor perceived quality across activities, regions, and time periods.
In this article you will learn:
- How Ratings analytics captures learner sentiment across training activities
- How ratings trends can be monitored over time and across audiences
- How ratings data supports quality assurance and governance
- How ratings differ from questionnaires and other feedback mechanisms
Purpose and Scope
Ratings are a lightweight but powerful feedback mechanism used to capture overall learner sentiment upon completion of a training activity. Unlike detailed surveys or questionnaires, ratings focus on impression rather than explanation—answering a simple question: How was this experience?
On your behalf, ratings can be enabled selectively at the activity level. This is intentional. Ratings are particularly effective for:
- Open or elective training
- Commercial or externally visible programs
- Partner enablement and customer education
- Discovery-driven learning catalogs
They are less suitable for mandatory or compliance-driven training, where low ratings may create bias without offering actionable explanation. In those cases, questionnaires, content engagement analytics, or adaptive learning insights are better tools for diagnosing issues.
Ratings Analytics and Reports are designed to help administrators and learning owners answer questions such as:
- Which activities are perceived most positively by learners?
- How many participants are contributing ratings?
- Are ratings trending up or down over time?
- How do ratings differ across regions, organizations, or activity types?
- Can we document sentiment as part of quality assurance or governance?
Ratings Analytics Overview
Ratings Analytics provides a visual, aggregated overview of all activities that received at least one rating during the selected period.
Key Counters
- Unique Users—The total number of distinct users who submitted at least one rating during the selected period
- Responses—The total number of rating submissions during the period. A single user may contribute multiple responses if they rated multiple activities
- Blocked users are included in analytics
- Deleted users are excluded
- Users remain included even if their signups are later cancelled or expired
- Cancelled or deleted activities are excluded from analytics
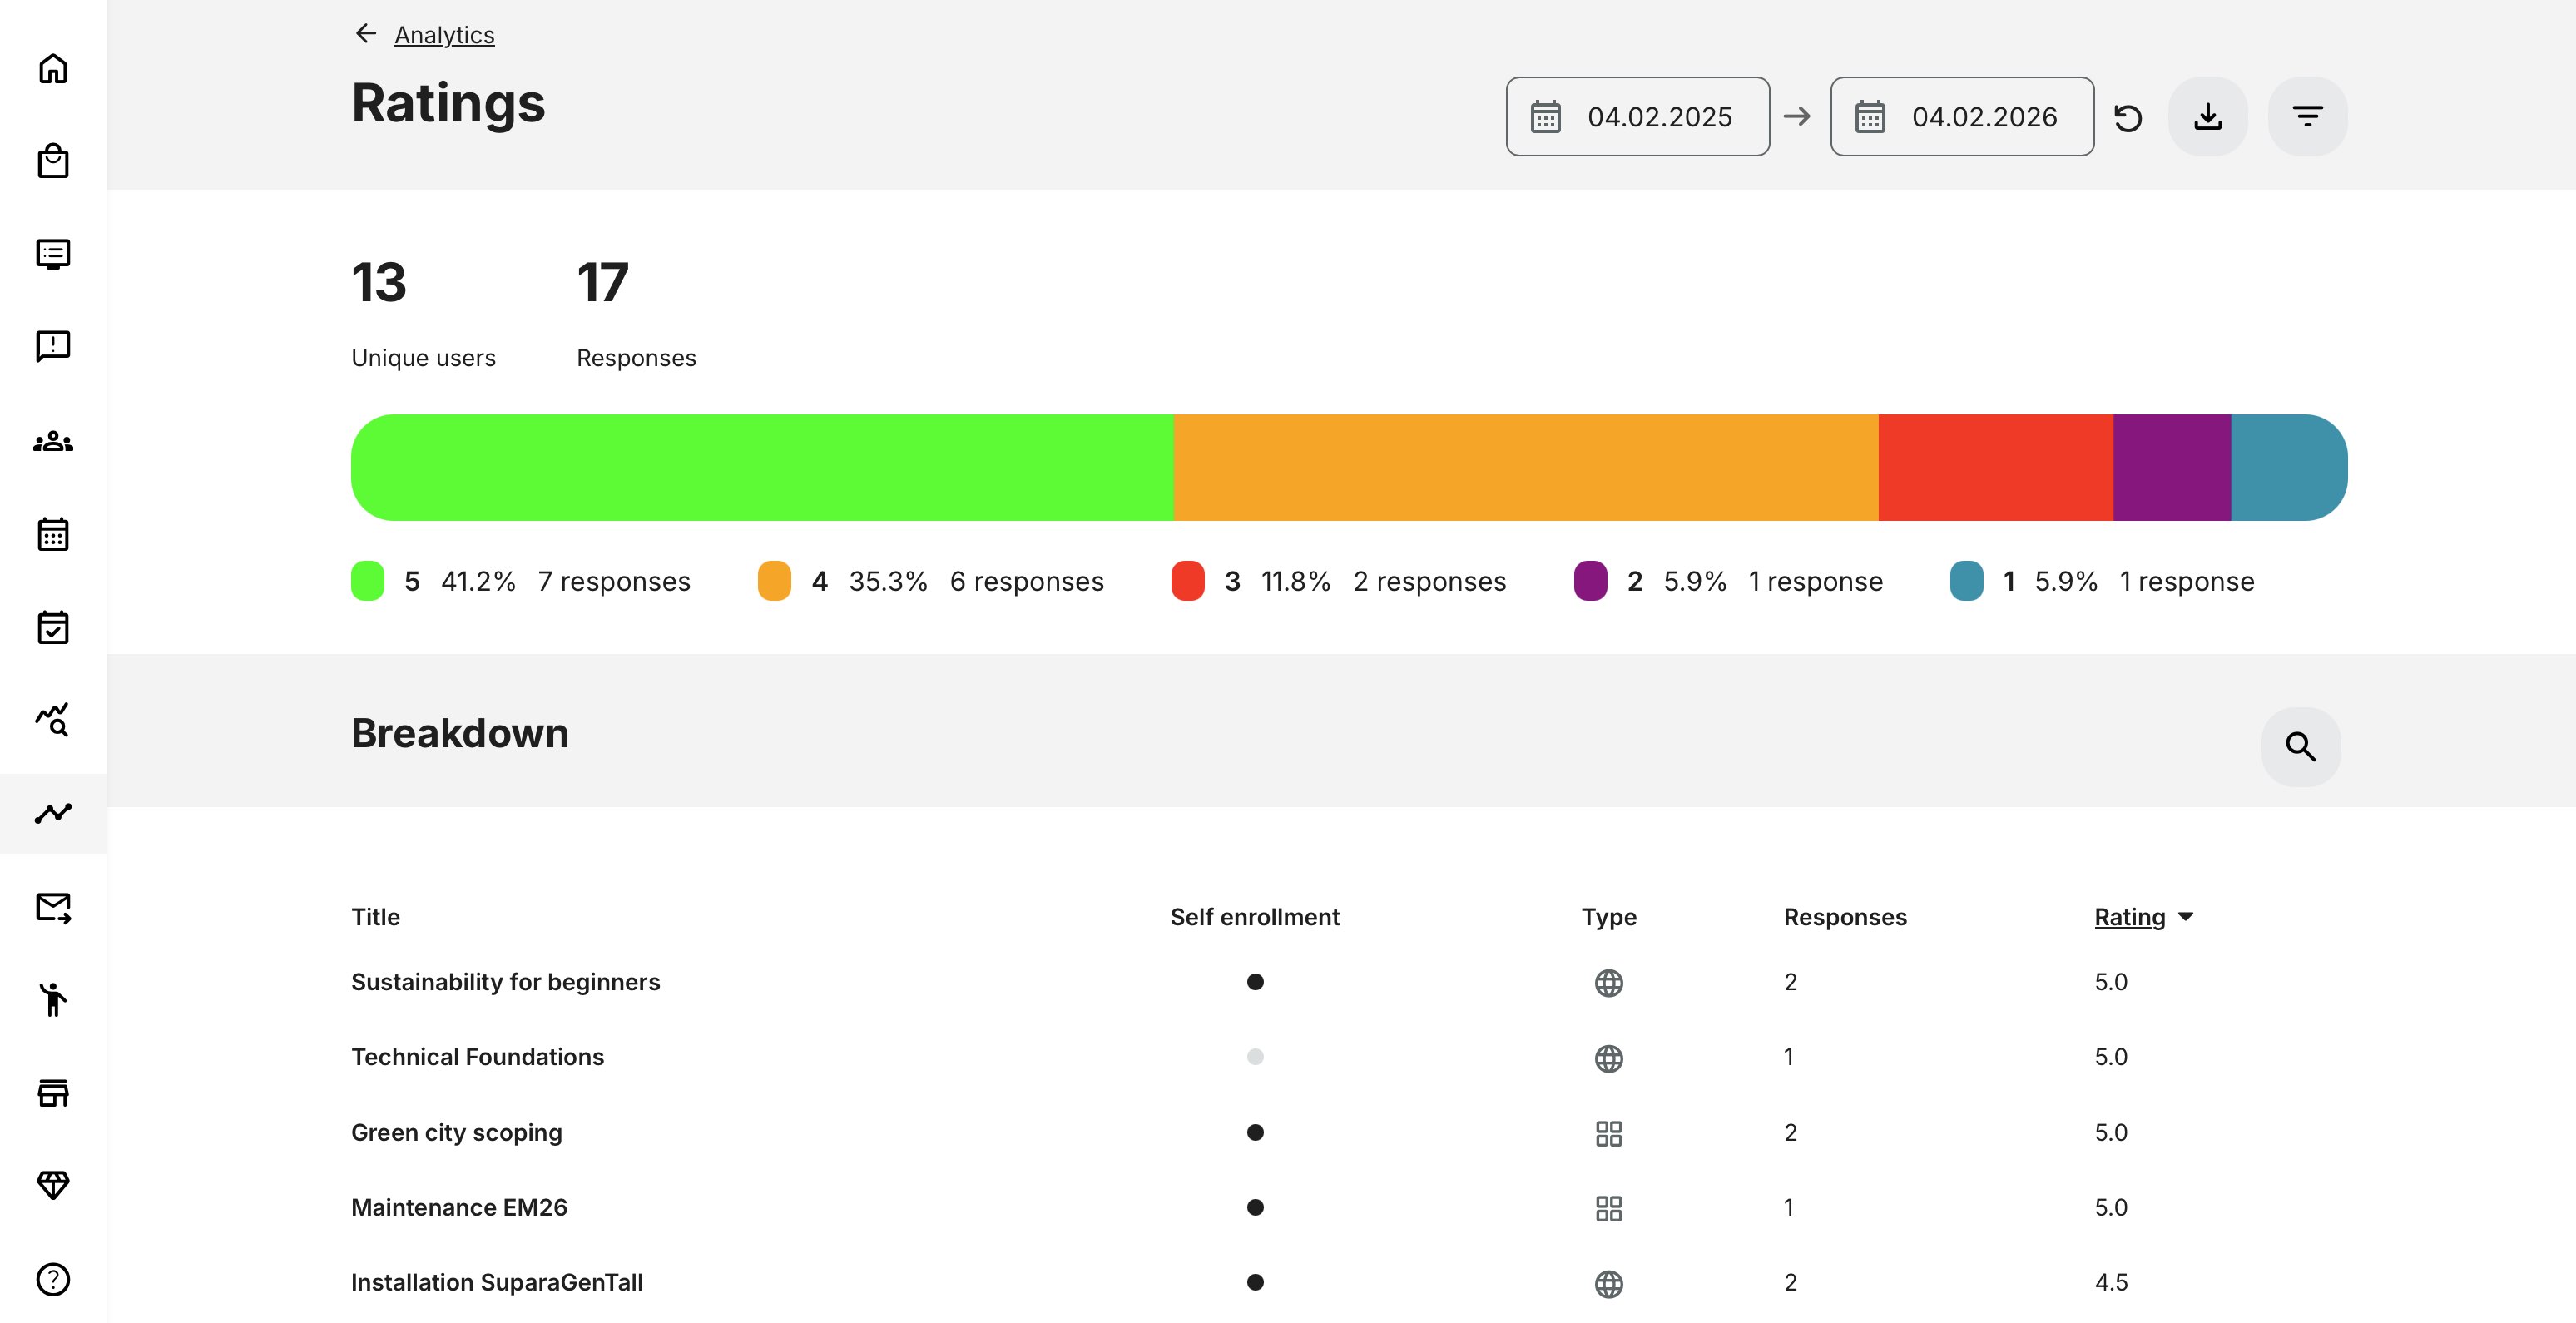
Rating Distribution (Horizontal Bar)
The horizontal bar visualizes how ratings are distributed across the 1–5 scale, showing both count and percentage for each rating value.
This provides an immediate snapshot of sentiment:
- High concentration of 4–5 → strong perceived quality
- Wide distribution → mixed experience or inconsistent delivery
- Heavy 1–2 concentration → potential quality or expectation issues
This view is especially useful for leadership and catalog owners who need a quick sense of how offerings are received overall.
Breakdown by Activity
The Breakdown section lists all activities that received ratings in the selected period.
For each activity, you can see:
- Title – Activity name
- Self-enrollment – Whether self-enrollment is enabled
- Type – Online, Classroom, Webinar, Learning Path, etc.
- Responses – Number of ratings submitted
- Rating – Average rating across all responses
By default:
- Activities are ordered by highest average rating
- The top 10 activities are shown initially with search by activity title or load more results.
This view supports comparison, prioritization, and quality benchmarking across the training portfolio.
Filters and Segmentation
Ratings Analytics can be filtered by:
- Category – tagging created by your administrators
- Activity type – Online, Classroom, Webinar, Learning Path, etc.
- Organization (with organization layer logic applied)
- Rating value (1 to 5)
- Country – User profile setting
Rating Filter Behavior
When filtering by a specific rating value (e.g. 4):
- Unique Users, Responses, and the Horizontal Bar show only exact matches (rating = 4)
- Breakdown shows activities with an average rating between 4.0 and 4.9
This allows administrators to identify activities that consistently perform within a target quality band.
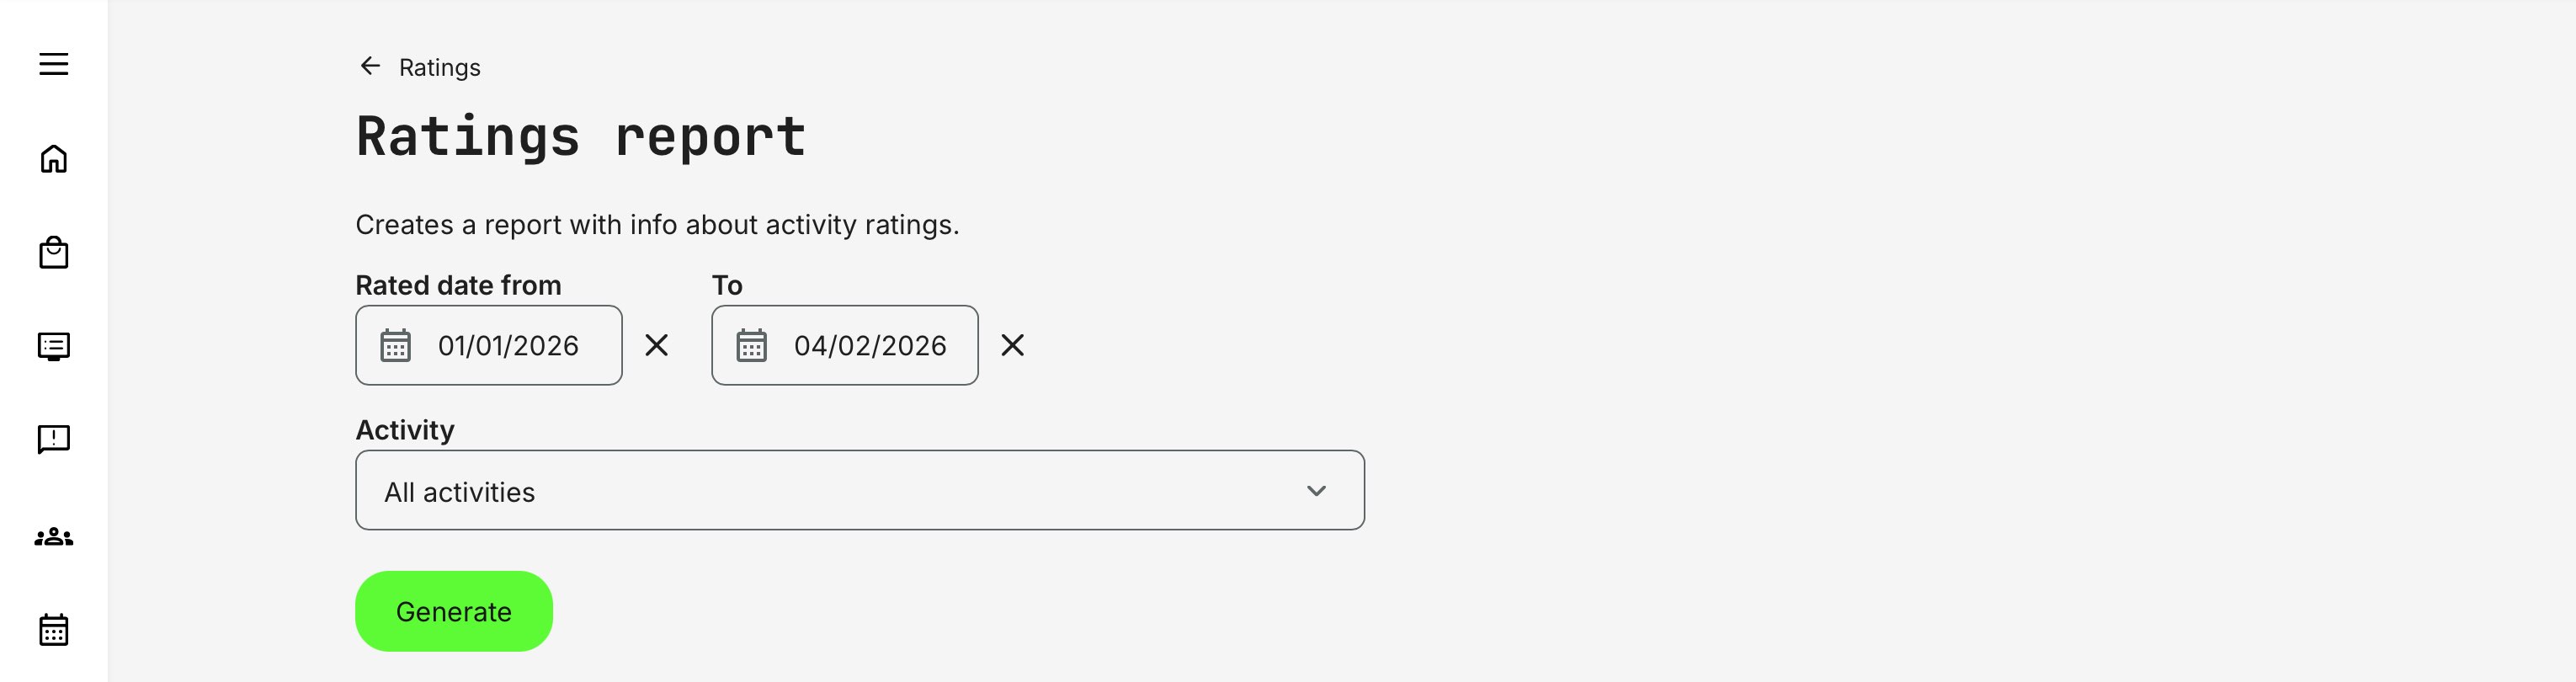
Ratings Report
While Ratings Analytics focuses on visual summaries and trends, the Ratings Report provides an exportable, record-level view of individual rating submissions. It is designed for deeper analysis, comparisons across cohorts or deliveries, and external reporting.
The report is accessed via [Get report] (download icon) and can be scoped using filters:
- Rated date range (from / to)
- Activity selection, allowing you to include all activities or focus on a specific set—useful when the same program is delivered multiple times across periods, cohorts, or instructors and needs to be compared consistently.
This makes the Ratings Report well suited for longitudinal analysis, quality assurance, and stakeholder reporting beyond what is visible in analytics alone.
Typical Report Fields
| Field | Description |
|---|---|
| Activity title | Name of the rated activity |
| User full name | Name of the respondent |
| Respondent email address | |
| Organization | Organizational context |
| Country | User country |
| Rating value | Submitted rating (1–5) |
| Submission date | Date and time of rating |
Permissions, Data Access, and Organization Layer
Rating Analytics and Report is governed by role-based permissions and the organization layer. Users can only see data they are authorized to access based on their role, organizational affiliation, and scope of responsibility.
In practice:
- Data visibility is limited to permitted organizations, activities, and entities
- Parent organizations can see aggregated sub-organization data; sub-organizations cannot see upward or sideways
- Blocked users remain visible for historical accuracy; deleted users are excluded for privacy compliance; Cancelled and expired enrollments remain visible for audit and traceability
- The same rules apply consistently to both on-screen analytics and exported reports
This ensures secure, consistent, and audit-ready access to data across the platform.
When to Use Ratings vs Other Feedback Tools
Ratings are designed to provide a quick, high-level signal of learner sentiment, while other feedback tools offer deeper diagnostic insight. The table below helps clarify when Ratings are the right tool—and when more detailed feedback or engagement analytics should be used instead.
| Scenario | Best Tool to Use | Why |
|---|---|---|
| Fast, intuitive sentiment signal | Ratings | Captures immediate overall satisfaction with minimal effort from learners |
| Aggregated quality indicators | Ratings | Provides average scores and simple comparisons across activities or periods |
| Social proof for optional or commercial training | Ratings | Helps prospects gauge perceived value before enrolling |
| Trend monitoring over time | Ratings | Enables high-level tracking of sentiment changes across cohorts |
| Need explanations and qualitative insight | Questionnaires | Collects open-text and structured feedback explaining why ratings exist |
| Root-cause analysis | Questionnaires / Content Engagement | Identifies friction points, misunderstandings, or design issues |
| Design and content optimization | Content Engagement Analytics | Shows how learners interact with specific content elements |
| Diagnostics for mandatory training | Questionnaires / Engagement Analytics | Avoids bias from ratings where participation is required |
Real-World Use Case: Public Training Portfolio Quality Monitoring
A professional training provider offers a catalog of optional, paid courses across multiple regions. Ratings are enabled on these activities and displayed on course description pages to support discovery and enrollment decisions.
Learning administrators monitor Ratings Analytics monthly/quarterly to:
- Identify top-performing courses to promote further
- Detect declining sentiment early
- Compare delivery formats (online vs classroom)
- Spot regional differences in learner perception
When an activity’s rating drops, administrators pull the Ratings Report and correlate sentiment with delivery conditions, instructor assignments, or recent content changes—before deciding whether deeper investigation via questionnaires or content engagement analytics is needed.
This approach ensures that ratings remain a trustworthy signal, while deeper analytics are used to drive improvement behind the scenes.
Best-Practice Guide: When Not to Enable Ratings
Ratings are a powerful and widely trusted mechanism for capturing overall learner sentiment. However, they are not universally appropriate. In some contexts, enabling ratings can introduce bias, reduce motivation, or obscure the real learning objectives.
The table below outlines common scenarios where ratings are not recommended, why that is the case, and what to use instead.
| Scenario | Why Ratings Are Problematic | Better Alternatives |
|---|---|---|
| Mandatory or Compliance Training | Learners must complete the training regardless of quality. Ratings often reflect frustration with obligation, not training effectiveness, and may demotivate participants before they start | Questionnaires focused on clarity and relevance, Content Engagement Analytics, Learning Performance Analytics |
| Legal, Safety, or Regulatory Training | These programs confer authority or permission to act. Public sentiment should not influence perceived legitimacy or compliance obligations | Certification tracking, pass/fail assessments, audit-ready reports |
| Early-Stage or Pilot Programs | Content and delivery are still evolving. Early ratings can permanently bias perception of a program that is not yet finalized | Targeted questionnaires, instructor feedback, internal reviews |
| Highly Specialized or Small Audiences | Low response volumes make averages unreliable. Outliers can disproportionately skew ratings and misrepresent overall value | Qualitative feedback, expert reviews, content engagement metrics |
| When Explanations Matter More Than Sentiment | Ratings show how it felt, not why. They do not explain friction, confusion, or design issues | Open-text questionnaires, adaptive learning analytics, content engagement analysis |
Used deliberately, ratings act as a trusted recommendation signal. Used indiscriminately, they risk becoming noise rather than value.
Special Case: Individually Scheduled Instructor-Led Training
Ratings are generally not recommended when training is delivered as many individually scheduled, instructor-led activities—even when content, structure, and learning objectives are identical. This is especially relevant when deciding whether ratings should be public-facing or primarily used for internal analysis and comparison.
In these scenarios, each session exists as a separate activity entity on the platform. Ratings are therefore collected per session, not across a shared or recurring training offering. As a result:
- Ratings reflect the experience of one specific session, not the training concept or program as a whole
- Identical sessions are not aggregated, because they are technically unrelated activities
While such ratings can still be useful internally—for example, for back-office reporting or instructor feedback—they do not work well as public-facing recommendations.
In practice, this limits the value of ratings as:
- A discovery or comparison signal
- A confidence indicator for prospective participants
- A representation of overall program quality
Recommended approach instead
For this delivery model, consider the following alternatives:
- Use structured questionnaires to collect comparable feedback across sessions—especially when ratings do not need to be public or part of the sign-up flow. This makes it easier to aggregate, filter, and analyze results afterwards (for example, by instructor, cohort, or region)
- If needed, present a manually curated statement / ratings on the activity description page (such as overall satisfaction, testimonials, or program-level insights), updated periodically rather than calculated automatically
This approach ensures that insight is drawn from comparable, aggregated data, rather than fragmented session-level scores that can unintentionally misrepresent the true value of the training offering.