Time and Engagement Analytics - Article
Summary
Time and Engagement Analytics shows how long learners spend in training and how actively they interact with content across the platform. It helps administrators understand engagement intensity, compare participation patterns, and evaluate how learning effort aligns with program expectations.
In this article you will learn:
- How time spent and engagement are measured across learning activities
- How administrators analyze participation intensity and usage patterns
- How time and engagement data supports evaluation of learning design
- How this analytics view helps identify trends across users and programs
Purpose and Scope
Time and Engagement Analytics is designed to answer a core question that sits at the intersection of learning, performance, and business value:
“Are people actually investing time in learning—and is that effort aligned with our expectations?”
Unlike completion or certification metrics, this analytics view focuses on learning effort: how many people engage, how much time they spend, and how engagement is distributed across activities and organizations.
This makes it particularly valuable for organizations that:
- Operate certification or enablement programs with expected effort thresholds
- Manage partner, reseller, or customer education ecosystems
- Sell or bundle learning subscriptions and need to demonstrate value-in-use
- Monitor whether learning investment correlates with performance, churn, or support demand
- Want to compare engagement levels across regions, customers, or cohorts
Time and Engagement Analytics is visual by design and optimized for comparative insight, not raw exports. It works especially well when used alongside Completion, Certification, and Learning Performance analytics.
What Data Is Included
Time and Engagement Analytics aggregates time-based engagement data for participants who have spent non-zero time in activities during the selected period. Use the date picker to analyze shorter periods, such as quarters, campaigns, or program phases.
Inclusion Rules
- Blocked users are included
- Deleted users are excluded
- Cancelled and expired signups are included
- Cancelled activities are included
- Deleted activities are excluded
- Activities with zero time spent are excluded from the view
This ensures the analytics reflect actual learning effort while preserving historical accuracy.
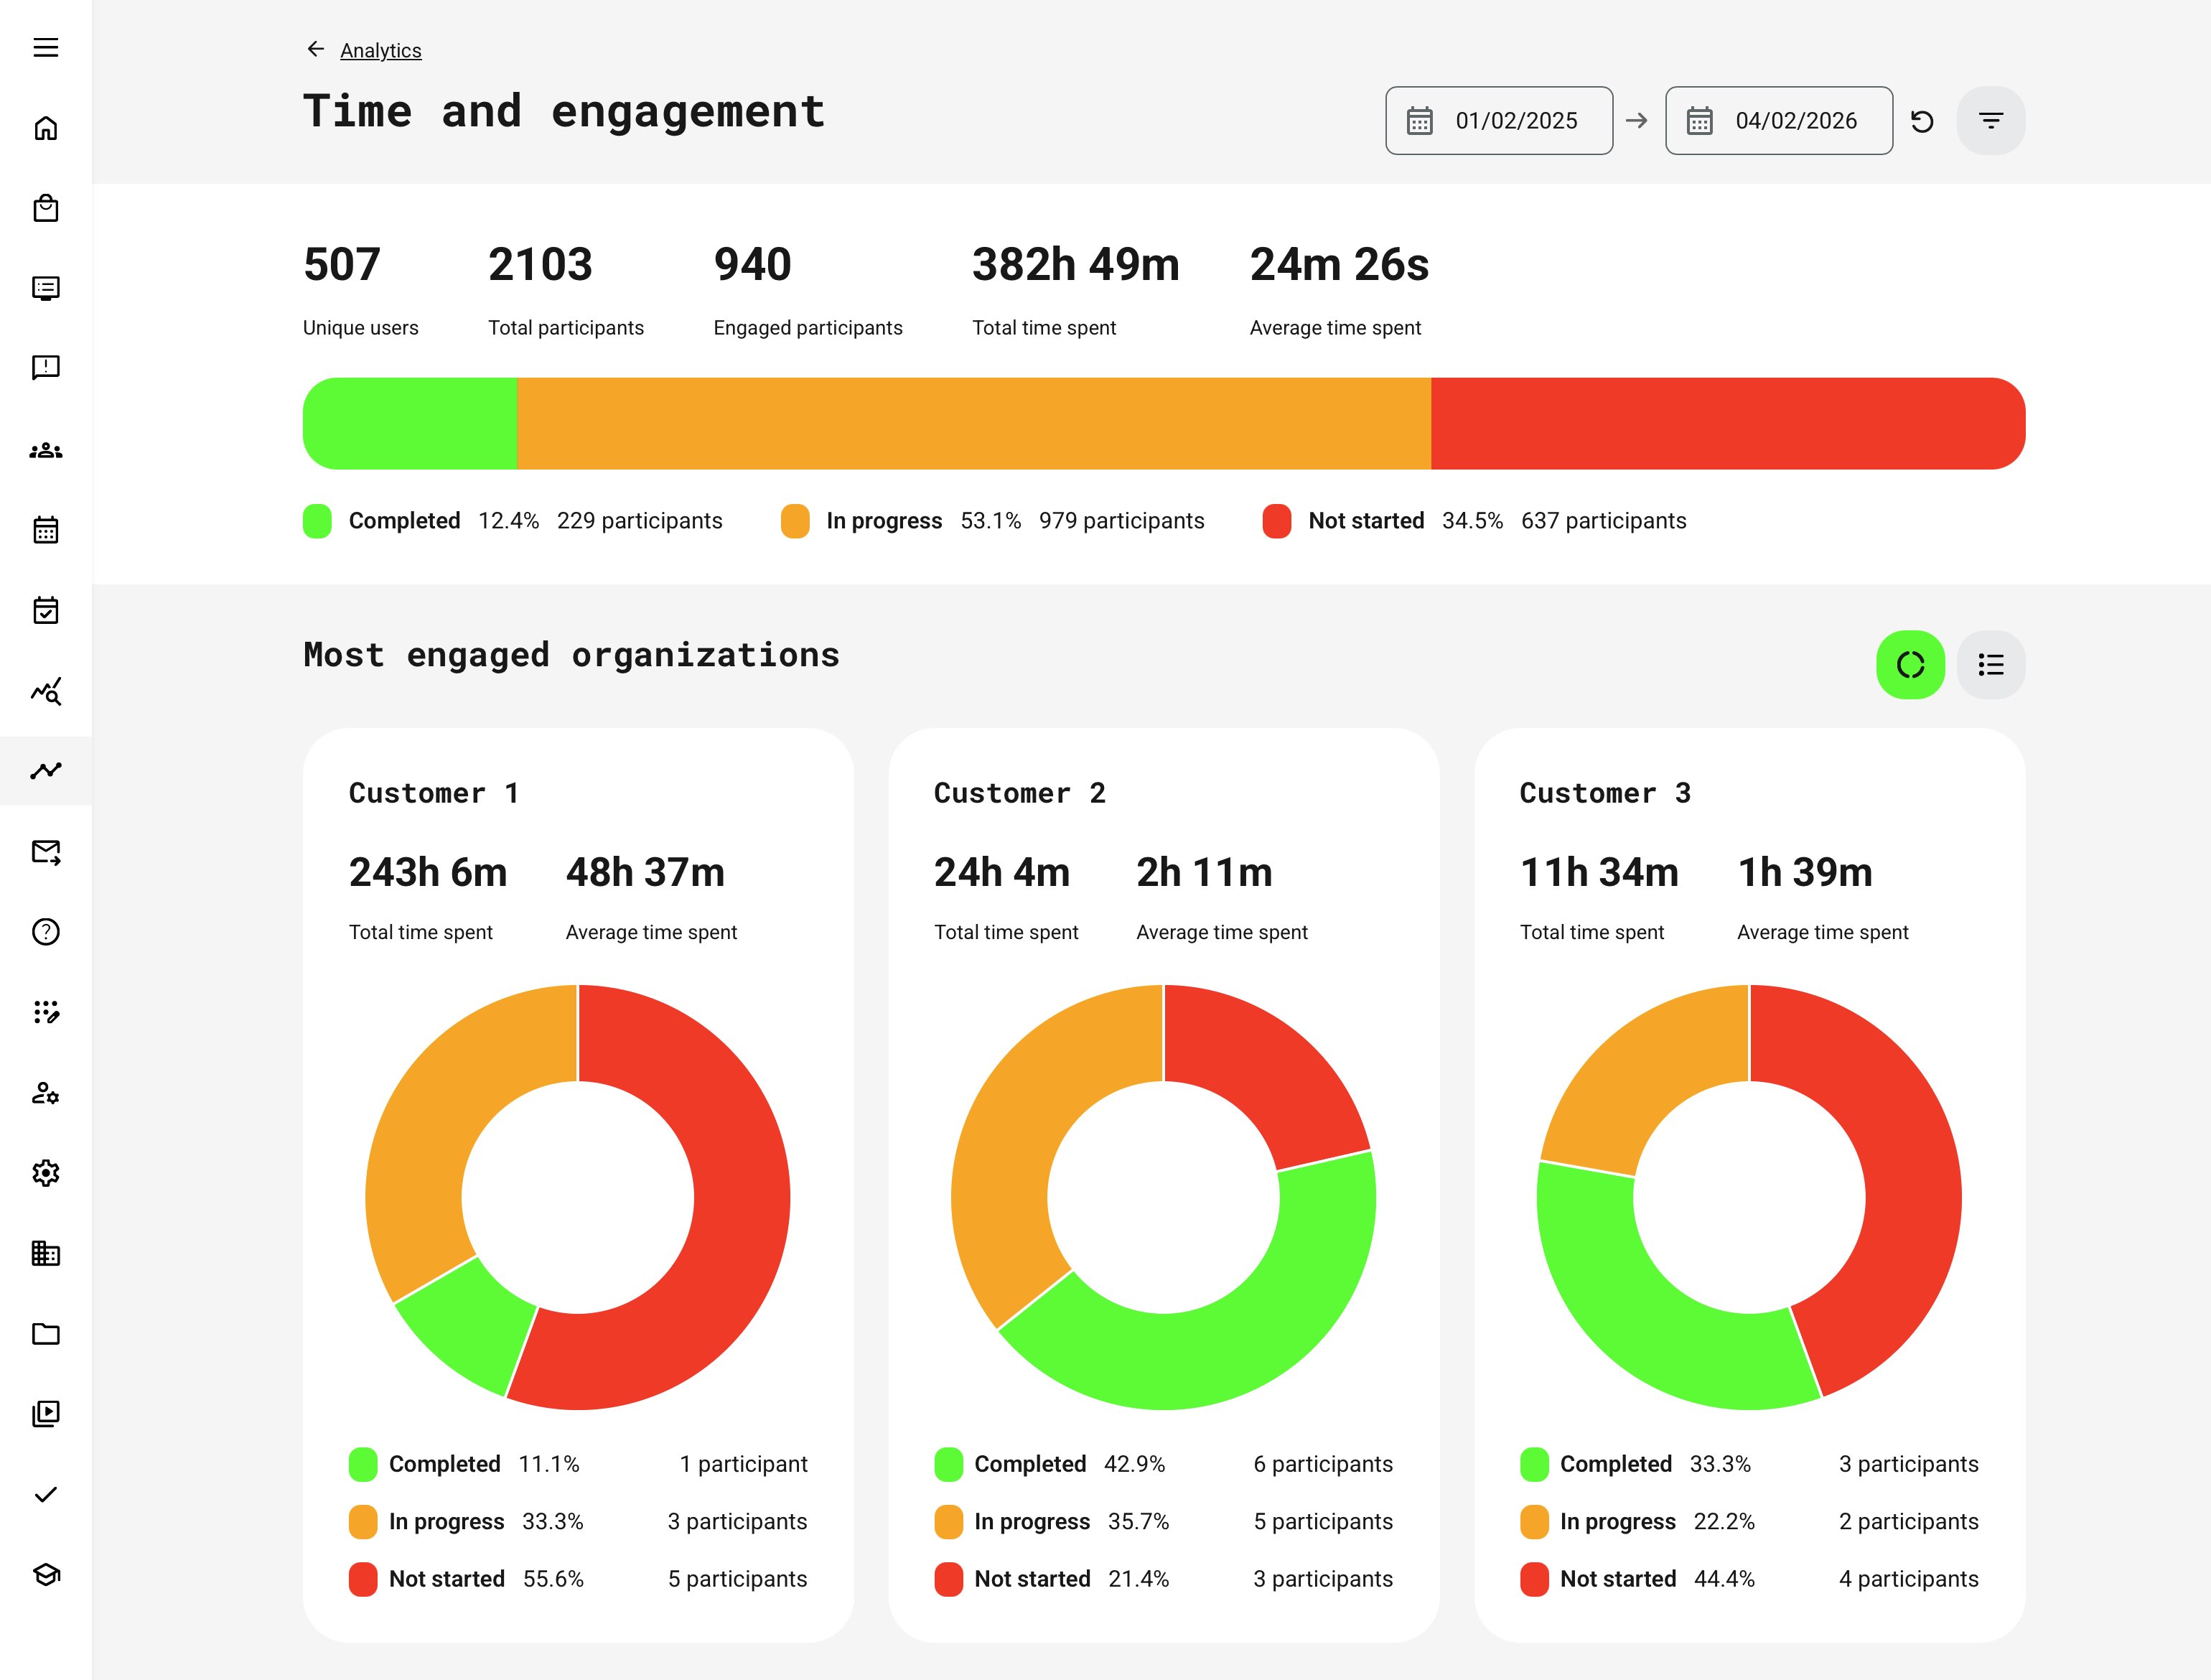
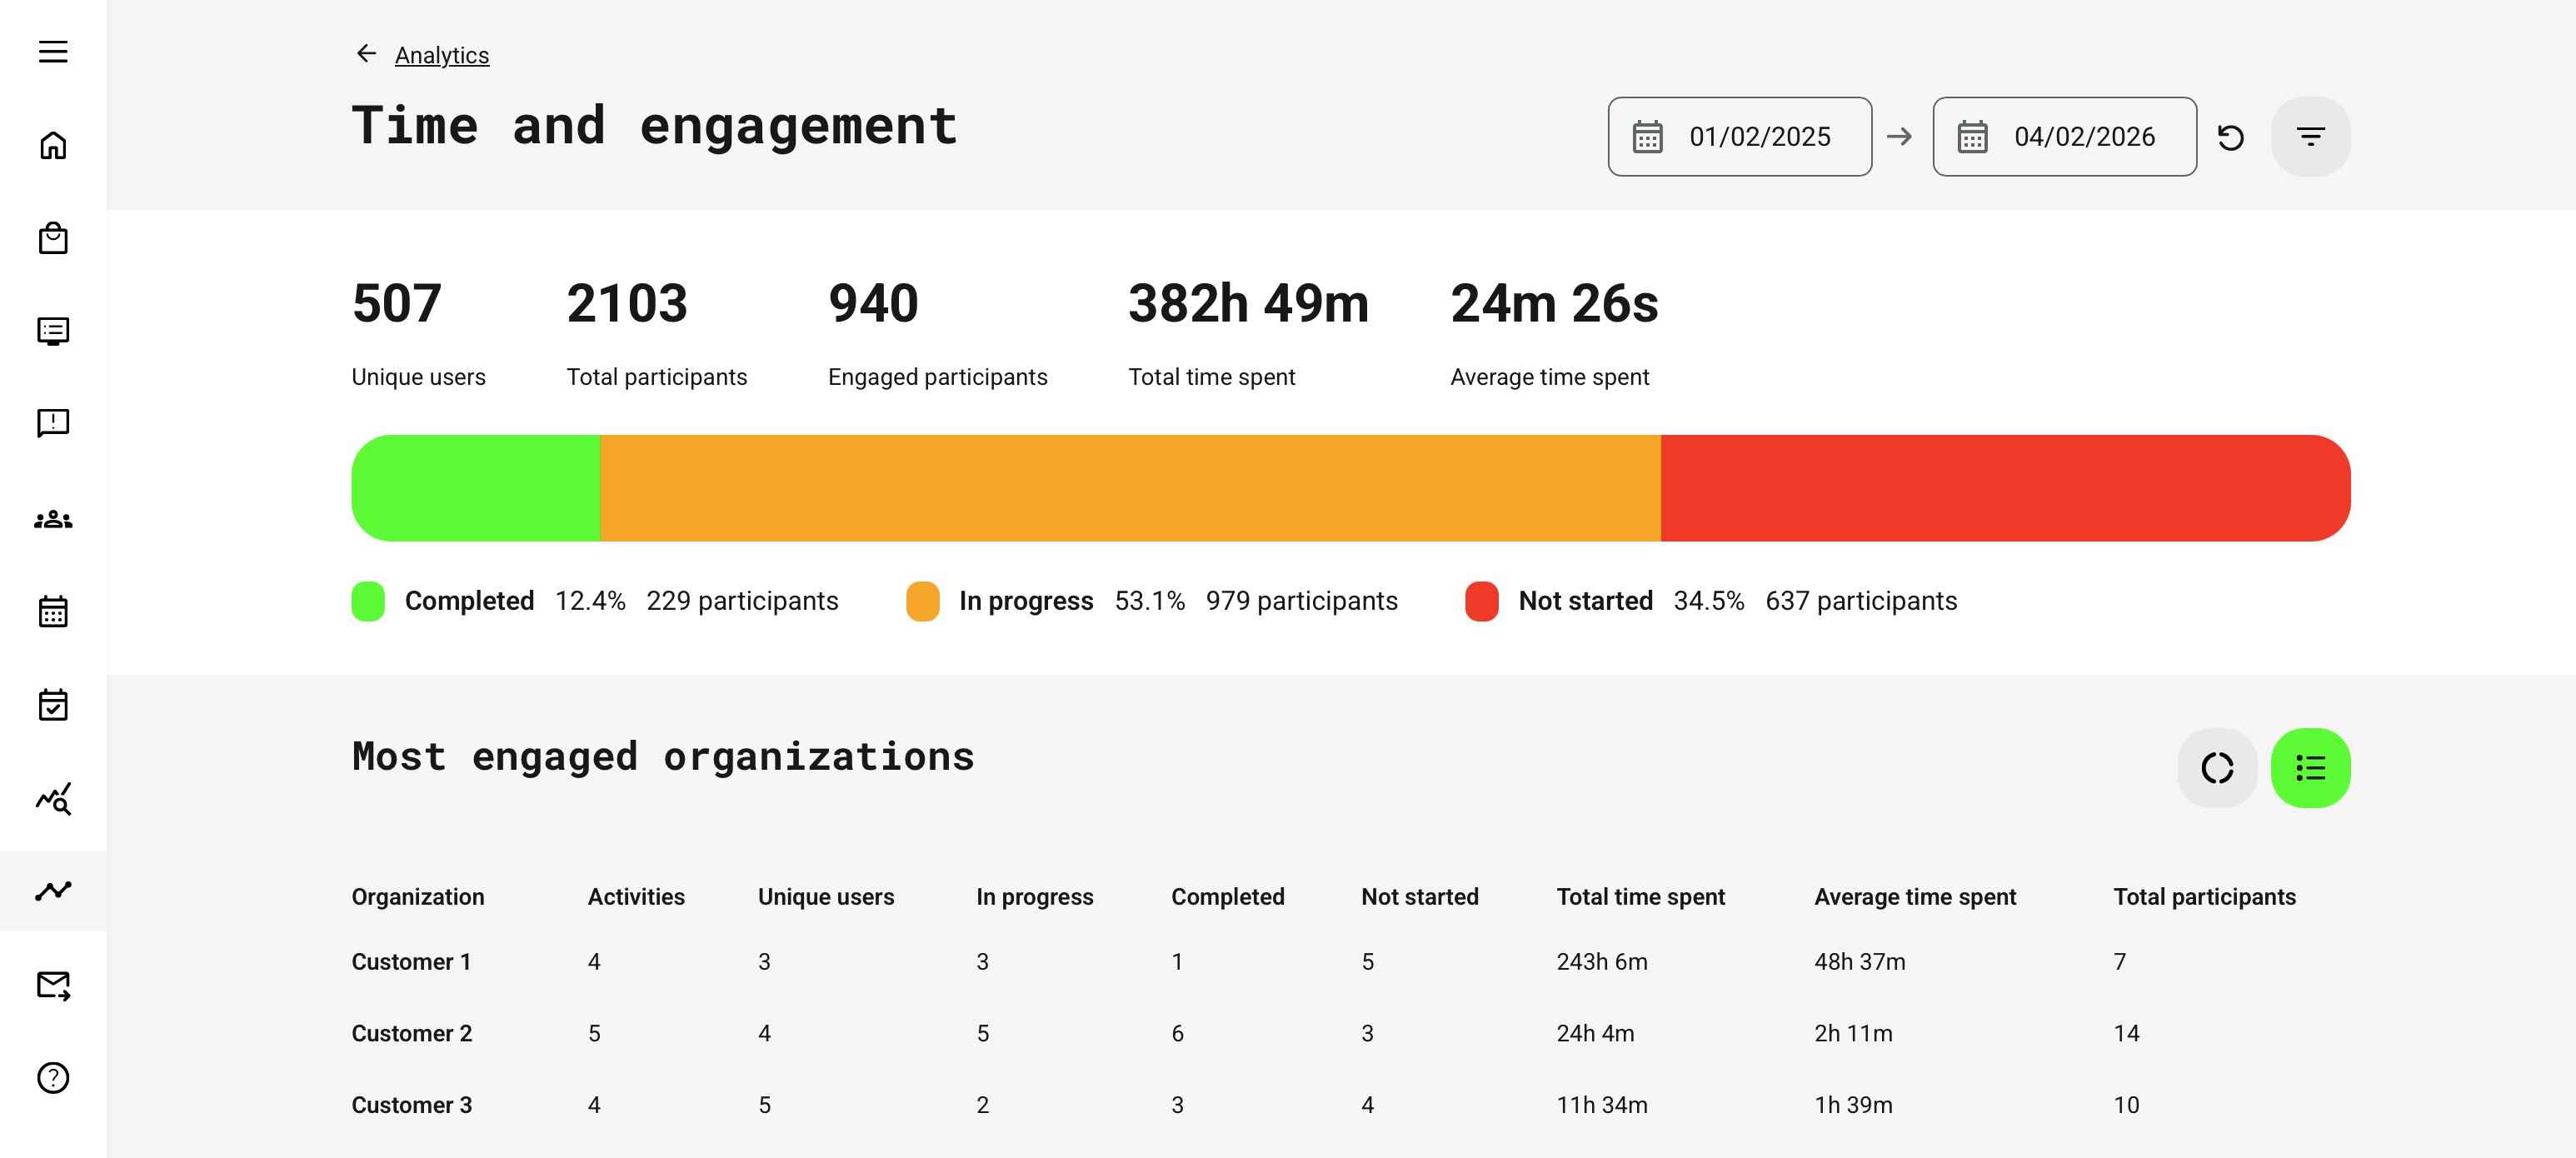
Key Metrics Explained
The table below explains the key metrics used in Time & Engagement Analytics and how to interpret them. Together, these measures provide a balanced view of reach, participation, and learning effort—helping administrators, managers, and partner owners understand not just how many learners are involved, but how actively they are engaging and how that engagement translates into progress over time.
| Metric | Description | What to Use It For |
|---|---|---|
| Unique Users | The number of distinct participants who recorded non-zero time spent during the selected period. Each user is counted once, regardless of how many activities they are enrolled in | Understand reach and breadth of engagement across the audience |
| Total Participants | The total number of enrollments with non-zero time spent, including multiple enrollments per user | Assess program scale and overall enrollment volume |
| Engaged Participants | Participants who have non-zero time spent during the period, have a latest status of In progress or Completed, and did not complete the activity before the selected start date | Measure active learning engagement rather than historical completion |
| Total Time Spent | The cumulative time spent by all engaged participants within the selected period | Quantify overall learning effort and time investment |
| Average Time Spent | Calculated as total time spent divided by engaged participants | Compare learning effort across organizations, partners, programs, or time periods |
| Completion Status Distribution | Participants grouped into Completed, In progress, and Not started, displayed as a horizontal bar with counts and percentages | Quickly assess learning momentum, progress, and potential friction points |
Organizational Comparison
Displays the top three organizations ranked by total time spent.
If the Organization filter is applied, this section becomes a Breakdown, showing all selected organizations instead of just the top three.
For each organization, the analytics show:
- Total time spent
- Average time spent
- Distribution of Completed / In progress / Not started participants
Use this to: benchmark engagement across customers, partners, regions, or departments.
Filters and Segmentation
Time and Engagement Analytics supports filtering by:
- Activity
- Activity type
- Organization (including sub-organizations)
- Country
Key behaviors to understand:
- Organization and Country filters respect the latest user profile revision
- Activity type respects the latest activity revision
- Only activities with non-zero time spent appear
- When filtering by Organization, deleted organizations are excluded and their time is no longer attributed
Permissions, Data Access, and Organization Layer
Time and Engagement Analytics is governed by role-based permissions and the organization layer. Users can only see data they are authorized to access based on their role, organizational affiliation, and scope of responsibility.
In practice:
- Data visibility is limited to permitted organizations, activities, and entities
- Parent organizations can see aggregated sub-organization data; sub-organizations cannot see upward or sideways
- Blocked users remain visible for historical accuracy; deleted users are excluded for privacy compliance; Cancelled and expired enrollments remain visible for audit and traceability
- The same rules apply consistently to both on-screen analytics and exported reports
This ensures secure, consistent, and audit-ready access to data across the platform.
How to Interpret Time and Engagement Data
| Observation | What It May Indicate | How to Validate or Correlate |
|---|---|---|
| High time spent | Strong learner engagement | Check completion and certification rates to confirm effort leads to outcomes |
| Complex or demanding content | Compare with content engagement analytics to see where time accumulates | |
| Friction or unclear learning design | Look for drop-offs, retries, or low completion despite high time | |
| Low time spent | Efficient and well-designed learning | Confirm with high completion and certification success |
| Superficial or rushed engagement | Check assessment results and content revisit behavior | |
| Content mismatch or low relevance | Compare engagement across audiences, roles, or regions | |
| Time spent + Completion analytics | Whether effort translates into finished learning | Identifies stalled or overly long programs |
| Time spent + Certification analytics | Whether effort leads to formal outcomes | Highlights inefficient or overly demanding certification paths |
| Time spent + Content engagement analytics | Where time is actually spent within activities | Reveals which pages, videos, or objects drive effort |
Key takeaway:
Time spent is a powerful signal—but only when interpreted alongside completion, certification, and content-level engagement. Used together, these analytics reveal whether learning time represents meaningful investment, efficient design, or hidden friction that needs attention.
Time spent should not be interpreted in isolation.
Real-World Example: Partner Enablement and Learning ROI
A software company runs a global partner enablement program bundled with product subscriptions. Certification is mandatory, but partners vary widely in engagement and performance.
Using Time and Engagement Analytics, the partner management team compares:
- Average time spent per partner organization
- Certification completion rates
- Support ticket volume per partner
They discover that partners with below-average learning time consistently generate more support requests and fail certifications more often. Rather than increasing certification difficulty, the organization introduces guided learning paths and recommended time benchmarks.
Six months later, Time and Engagement Analytics shows:
- Increased average learning time across underperforming partners
- Higher certification success rates
- Reduced support costs
The analytics did not just prove participation—it helped explain why outcomes differed.
When to Use Time and Engagement Analytics
Use Time and Engagement Analytics when you need to:
- Compare learning effort across organizations or partners
- Assess whether learning investment matches expectations
- Support value conversations with customers or stakeholders
- Identify under-engaged cohorts before issues escalate
- Complement completion and certification insights
It answers not just “Did they complete?” but “Did they truly engage?”
Partner Benchmarking Checklist
The following checklist provides a practical framework for using Time & Engagement Analytics to benchmark partners and organizations objectively. Rather than focusing only on enrollments or completions, it helps interpret learning effort, consistency, and commitment—turning time-based engagement data into actionable insight for enablement, performance conversations, and strategic follow-up.
| Step | Focus Area | What to Review | What It Tells You |
|---|---|---|---|
| 1 | Benchmark context | Selected time period, comparable programs, consistent organization scope | Ensures fair comparisons between partners and avoids skewed results |
| 2 | Learning effort | Average time spent, total time invested, number of engaged participants | Shows whether partners are investing meaningful time—not just enrolling |
| 3 | Engagement coverage | Ratio of engaged vs. enrolled users, Not started vs. In progress vs. Completed | Reveals whether engagement is broad or limited to a few individuals |
| 4 | Engagement distribution | Consistency of time spent across participants | Identifies reliance on “power users” vs. healthy organizational adoption |
| 5 | Outcome correlation | Time spent compared with certification and completion rates | Confirms whether learning effort translates into readiness and compliance |
| 6 | Risk detection | Partners significantly below average engagement or trending downward | Flags early warning signs for churn, underperformance, or support load |
| 7 | Comparative positioning | Engagement levels across regions, tiers, or partner types | Enables benchmarking and best-practice identification |
| 8 | Enablement dialogue | Data points used in partner or CSM conversations | Shifts discussions from opinion to evidence-based improvement |
| 9 | Follow-up actions | Targeted enablement, onboarding refresh, learning path adjustments | Turns insight into concrete actions and measurable improvement |
Summary Guidance
Time & Engagement Analytics is most powerful when used as a leading indicator, not a scorecard. High engagement does not automatically guarantee success—but consistently low engagement almost always explains why certification, performance, or adoption is falling short.
When combined with certification, completion, and content engagement analytics, this view enables organizations to:
- Benchmark partners objectively and fairly
- Identify underinvestment early—before it impacts outcomes
- Support data-driven conversations with partners and stakeholders
- Quantify learning effort as part of overall business value
In short, this checklist helps move the conversation from “Are our partners trained?” to “Are our partners investing enough time in learning—and is that investment aligned with our expectations?”