Active Users Analytics - Article
Summary
Active Users Analytics tracks unique platform logins across web, mobile, and QR access over time. It helps administrators monitor platform adoption, engagement trends, and organizational activity through visual dashboards and exportable usage reports.
In this article you will learn:
- How Active Users Analytics tracks unique platform logins over time
- How administrators analyze usage trends across web, mobile, and QR access
- How login data reveals adoption patterns across organizations and regions
- How usage analytics supports engagement monitoring and reporting
Overview
The Active Users Analytics dashboard provides administrators with a clear, structured view of how users access and engage with the Eurekos platform over time. It focuses specifically on login activity, allowing you to monitor adoption, usage patterns, and organizational engagement across web, mobile, and QR-based access.
This analytics view is designed to answer practical questions such as:
- How many unique users actively used the platform this year?
- How do users access the platform (web, mobile app, QR code)?
- Which organizations or regions are most active?
- How does activity evolve month-by-month or quarter-by-quarter?
Active Users Analytics combines high-level indicators with drill-down reporting, ensuring both operational visibility and audit-ready traceability.
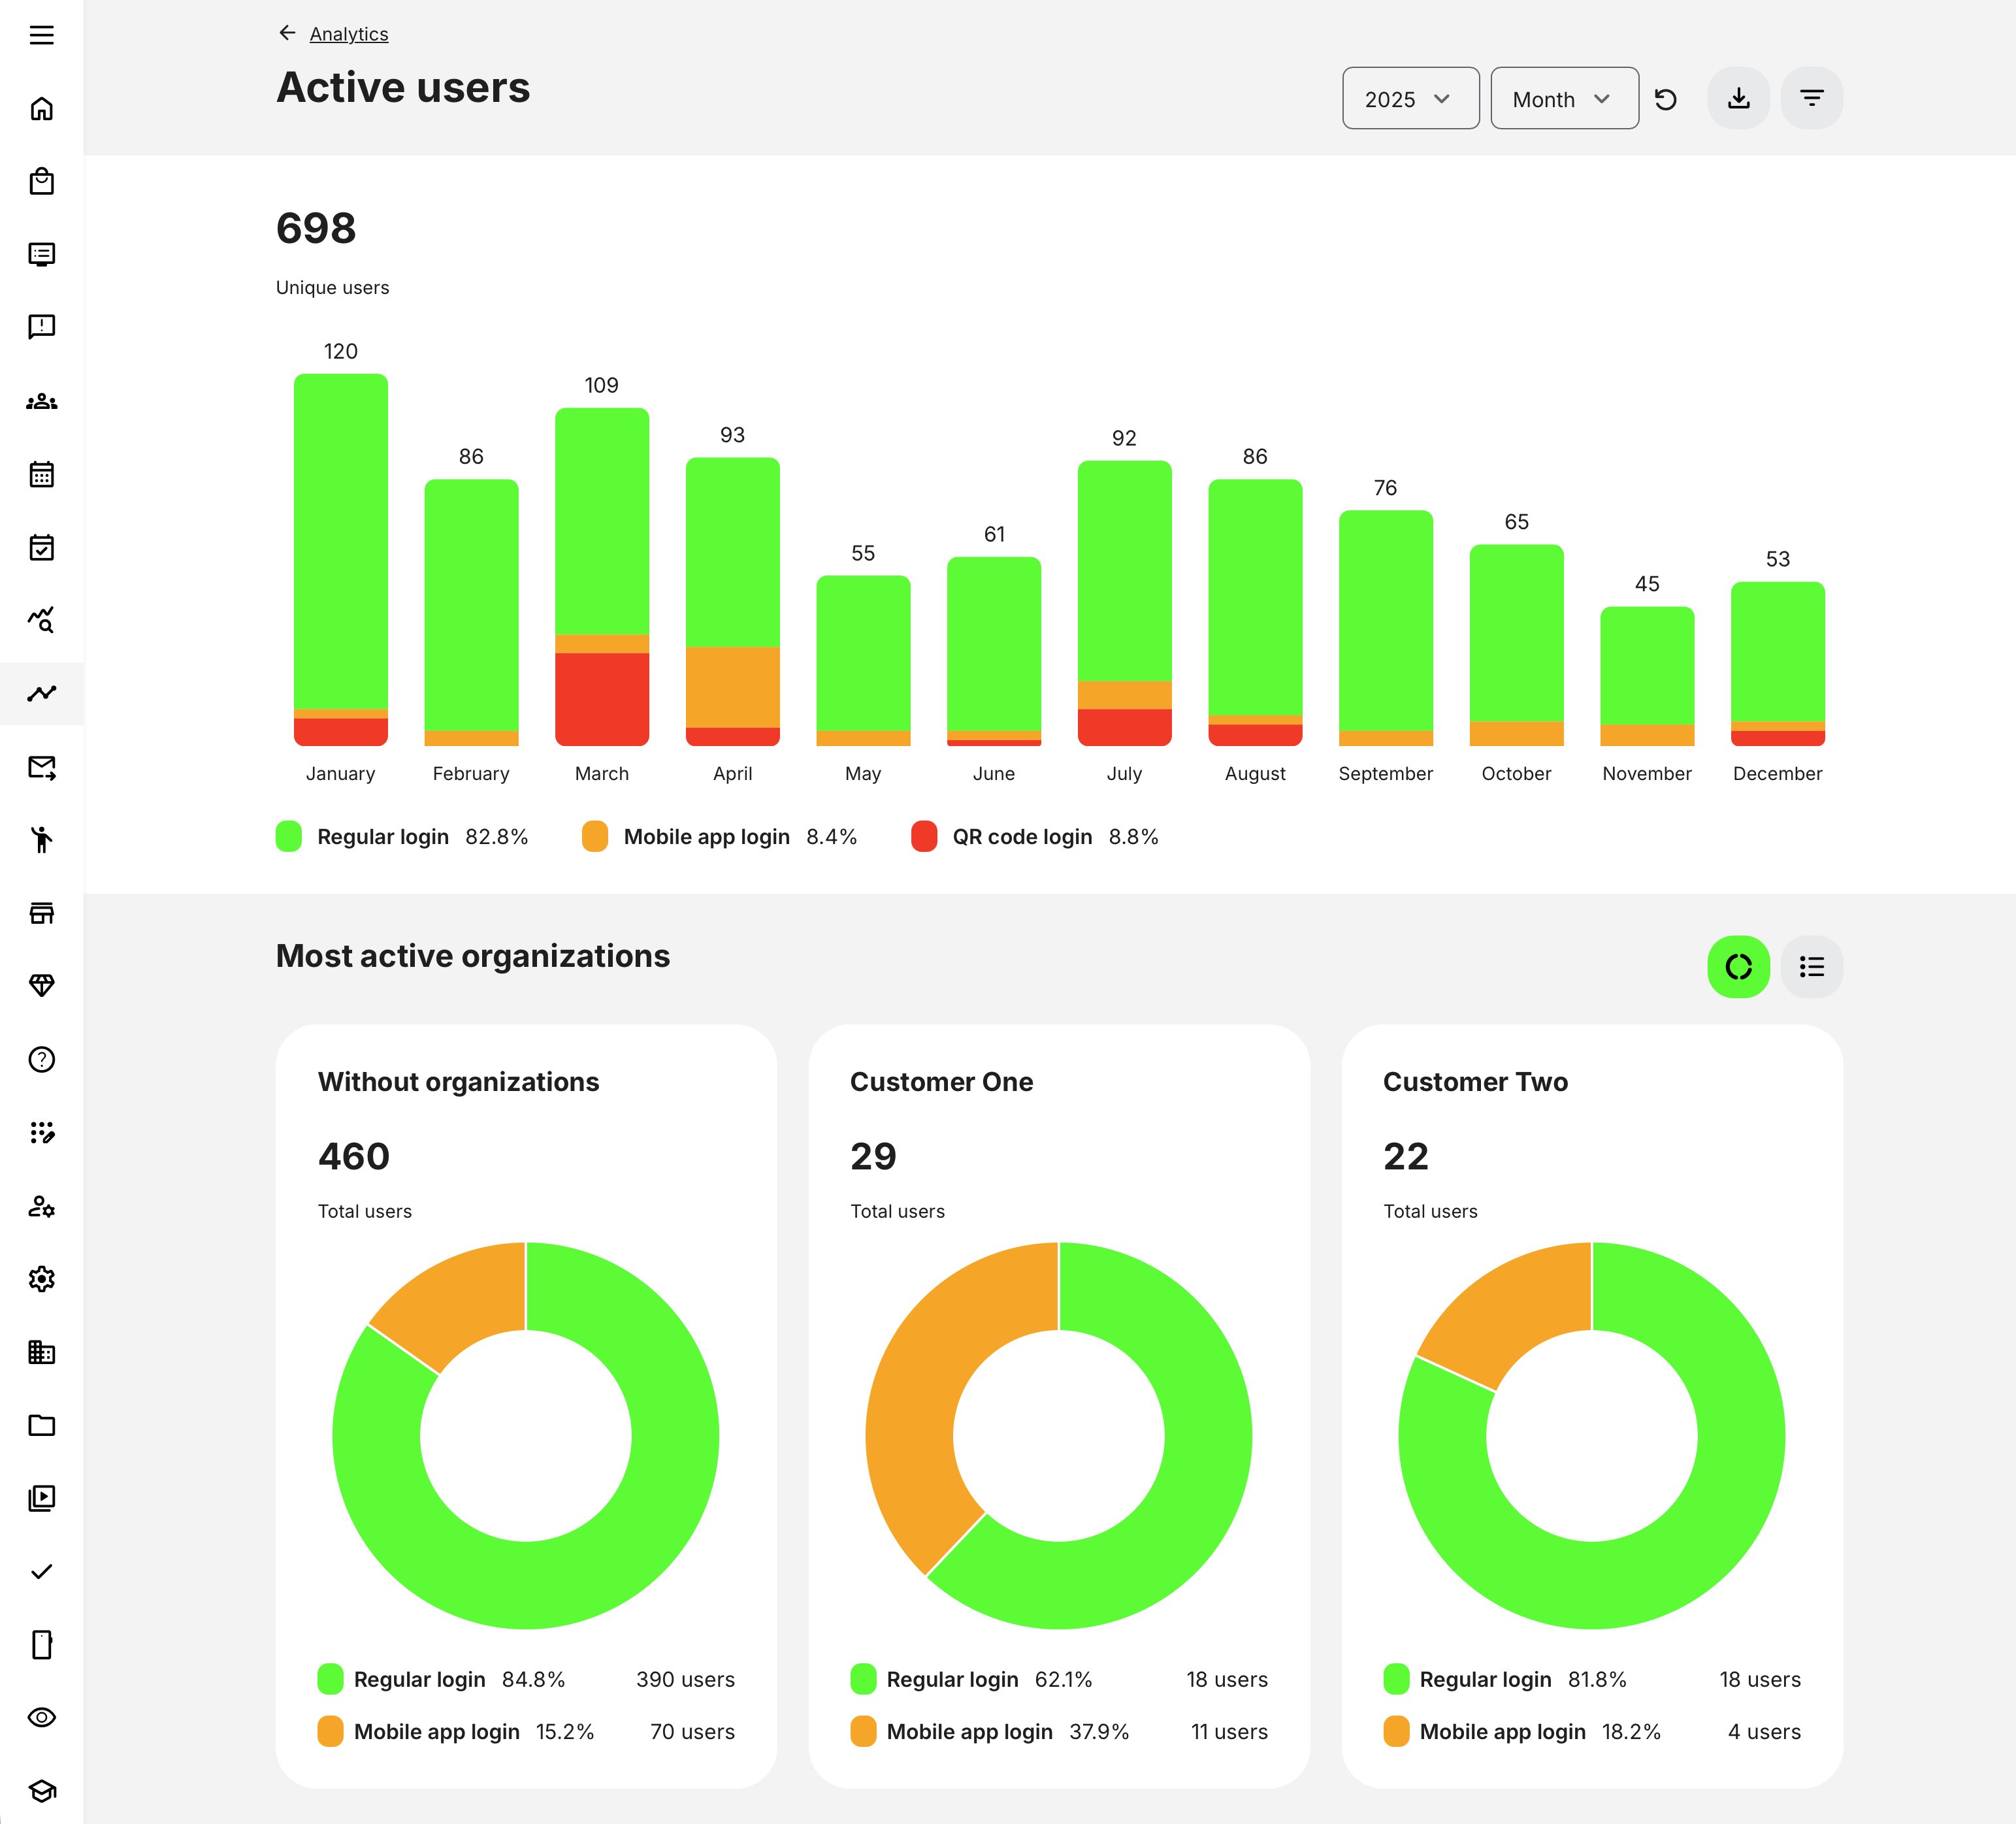
Unique Users
The Unique Users counter represents the total number of distinct email addresses that logged into the platform during the selected year.
A user is counted as active if any of the following occurred during the selected period:
- The user logged in via regular web login
- The user logged in via the mobile app (when applicable)
- The user accessed a course via a QR code (when applicable)
Important nuances:
- Each user is counted only once in the Unique Users total, regardless of how many times they logged in during the selected period
- If a registered user accesses content via QR code, they are counted both under their regular login type and under QR code login
- If a non-registered user accesses content via QR code, they are counted only once under QR code login
To extract the raw data behind this number, you can generate an Active Users report filtered by login type and date range.
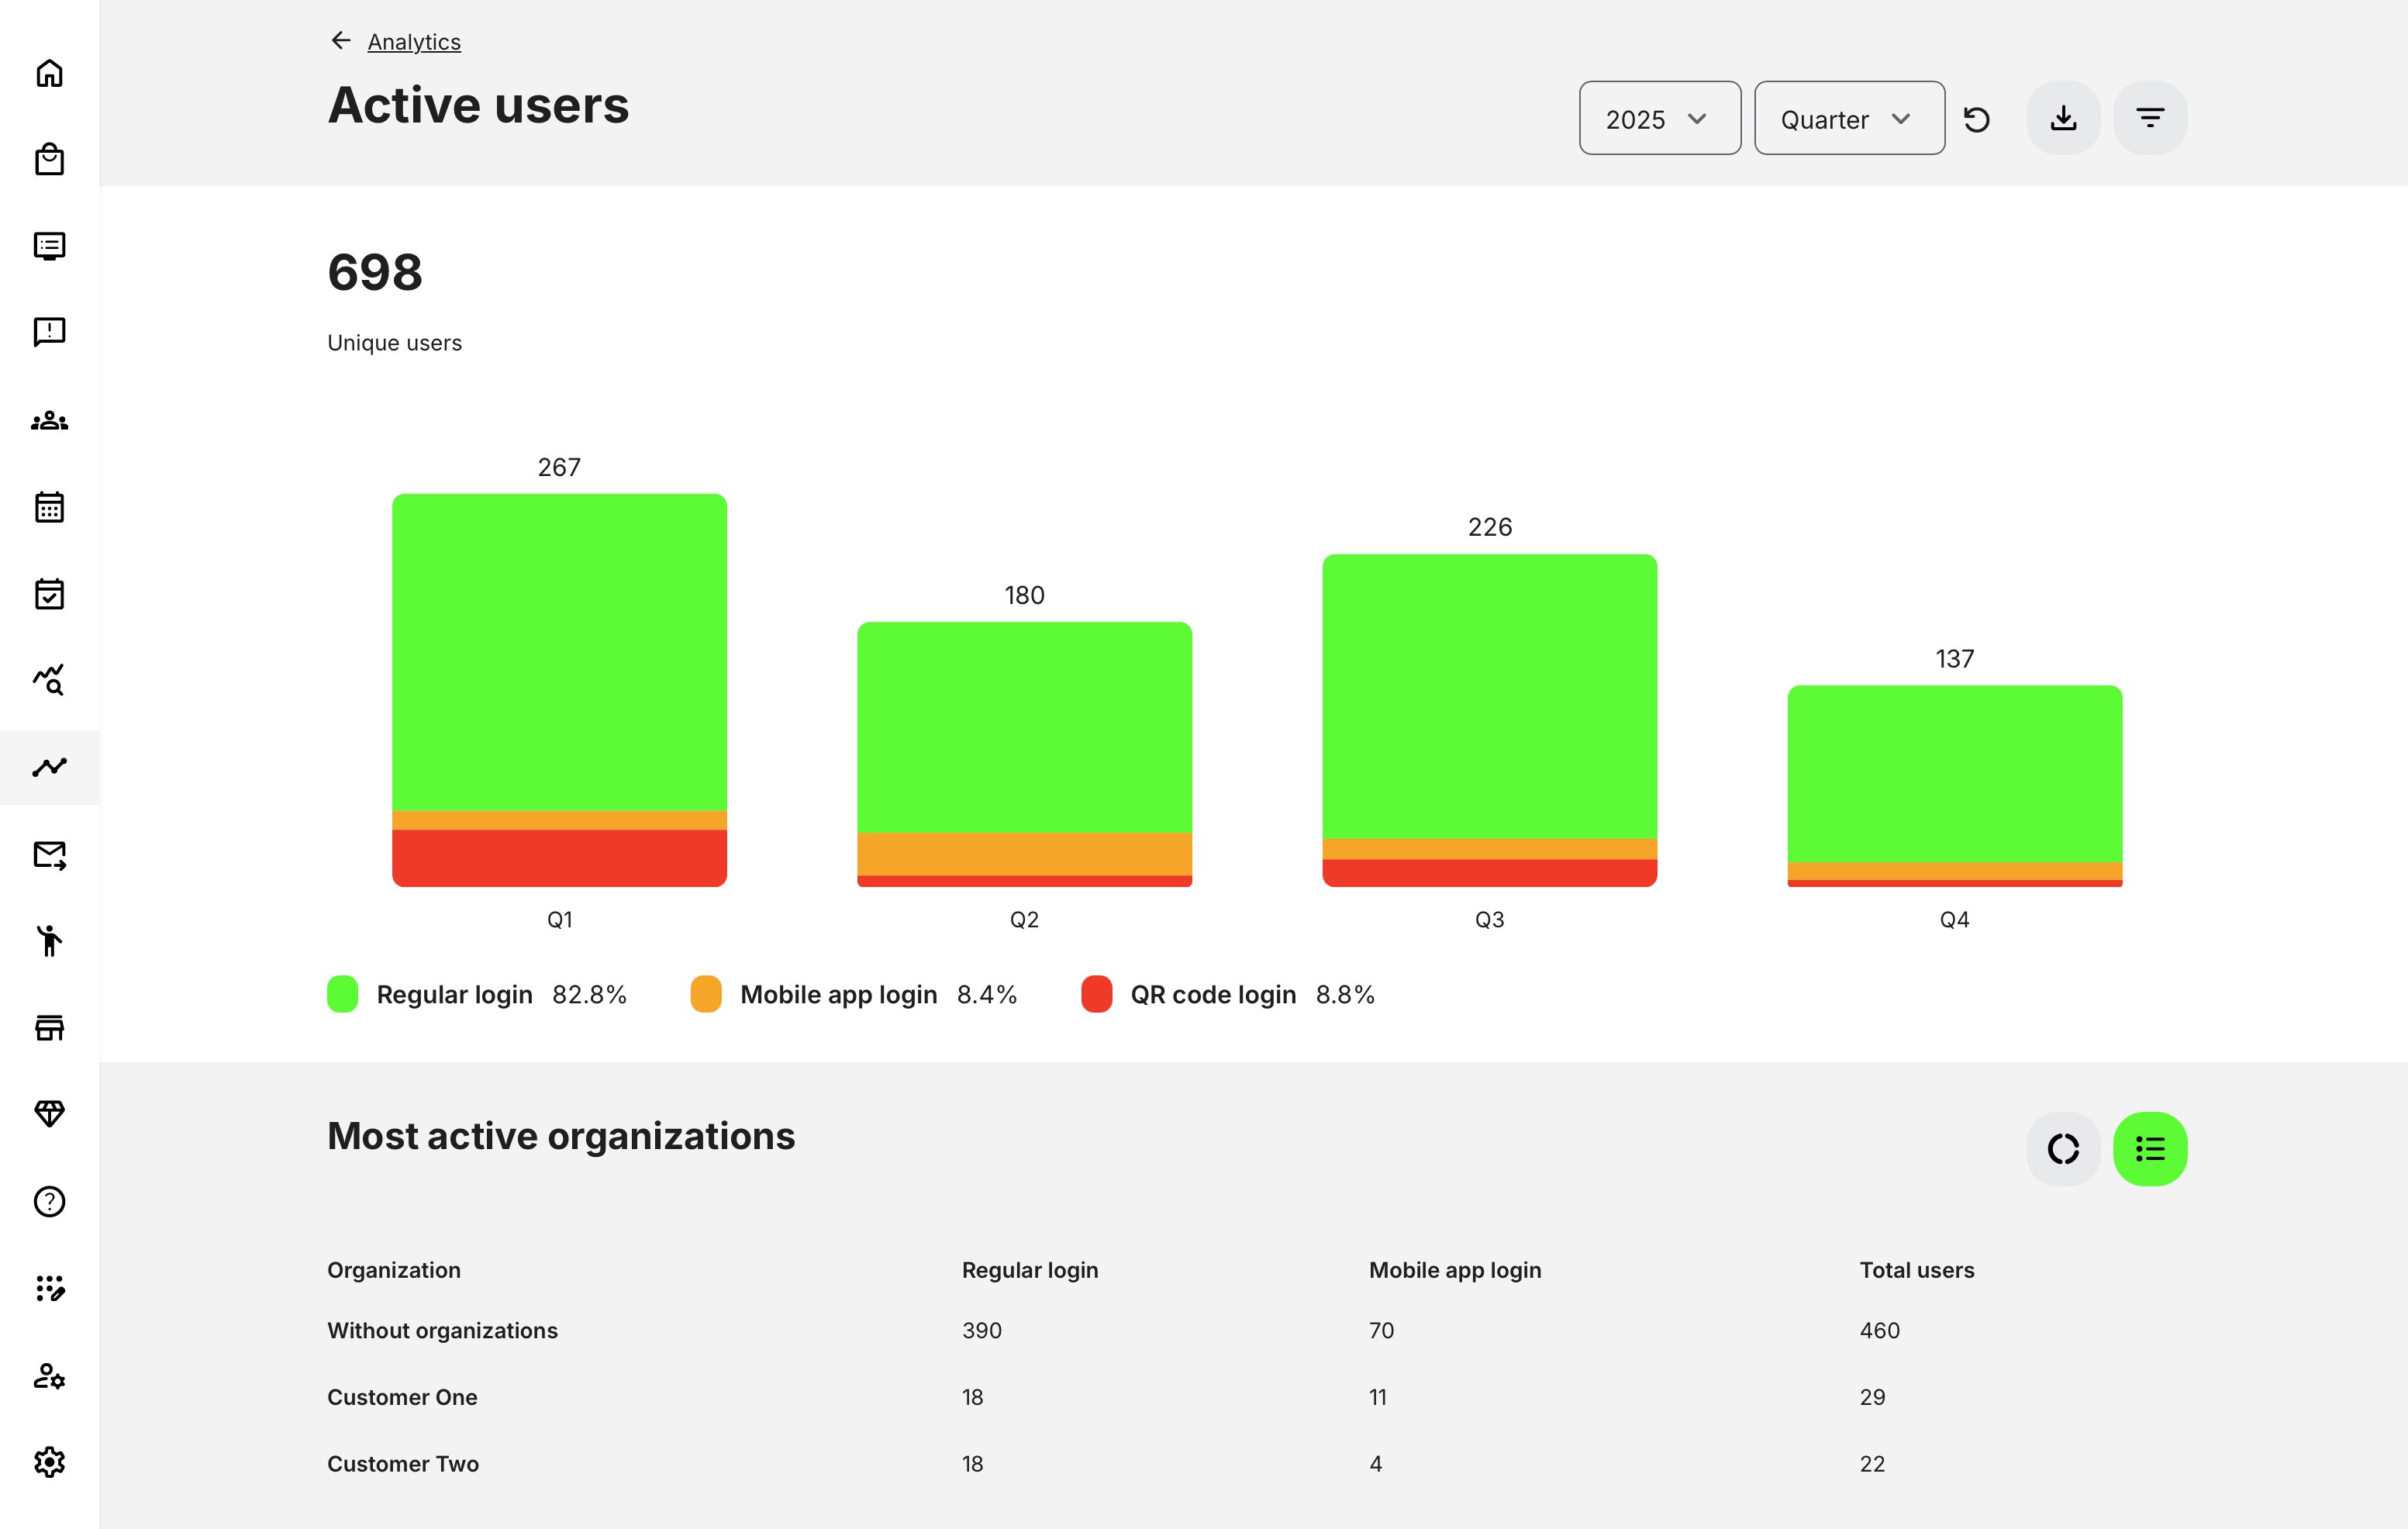
Login Activity Bar (Monthly & Quarterly)
The bar chart visualizes how users logged into the platform over time, broken down by login type:
- Regular login (web)
- Mobile app login
- QR code login
You can toggle between monthly and quarterly views.
Key behavior:
- A user is counted once per month or quarter, regardless of how many times they logged in during that period
- Each login type is shown as both a count and a percentage of total active users
This makes it easy to spot trends such as increasing mobile usage, seasonal engagement spikes, or reliance on QR-based access for events or on-site training.
Most Active Organizations
The Most Active Organizations section highlights the top three organizations or sub-organizations with the highest number of active users in the selected year.
For each organization, the dashboard shows:
- Total number of logins
- Breakdown by login type (regular vs. mobile app)
Important details:
- If a user logged in via both web and mobile, they are counted twice in total logins
- Organizations are ranked by total logins, not by unique users
- When the filter is applied, all selected organizations are shown in the breakdown—not just the top three. This enables direct visual comparison across specific customers, partners, regions, or departments that are in focus
Active Users Analytics supports two complementary views:
Chart View
- Displays each organization as a visual tile
- Shows proportional login distribution by login type
- Useful for quick comparison and pattern recognition
List View
- Displays the same data in a structured grid
- Useful for auditing, validation, and exporting insights
Deleted organizations are retained in the analytics for historical accuracy. They are clearly marked with [DELETED] to indicate that they existed during the reporting period but no longer do. For visual clarity, these organizations appear blurred in chart views and greyed out in list views.
Filters and Data Scoping
You can refine the analytics using filters for:
- Login type
- Country
- Organization
- Job Function
Filter behavior is consistent and intentional:
- Organization filters control which organizations appear in the breakdown
- Country filtering is based on the latest available user profile data
- Filtering by login type may cause totals across login types to differ from the Unique Users number, since a user can use multiple login methods
Data Refresh and Caching
Analytics data is cached for performance and updated automatically by background jobs:
- Hourly queue updates
- Five-minute processing cycles
If immediate updates are required, administrators can use the Reset action to trigger a refresh manually. This ensures the dashboard reflects the most current activity without requiring a system restart.
Reports and Export
The Get Report option (download icon) navigates directly to the Active Users report, where raw data can be exported for:
- Audits
- External BI tools
- Internal performance analysis
Reports align exactly with the data shown in the analytics dashboard, ensuring consistency between visuals and exports. For transparency and compliance:
- Blocked and deleted users are included in analytics.
- Deleted organizations remain visible to preserve historical accuracy.
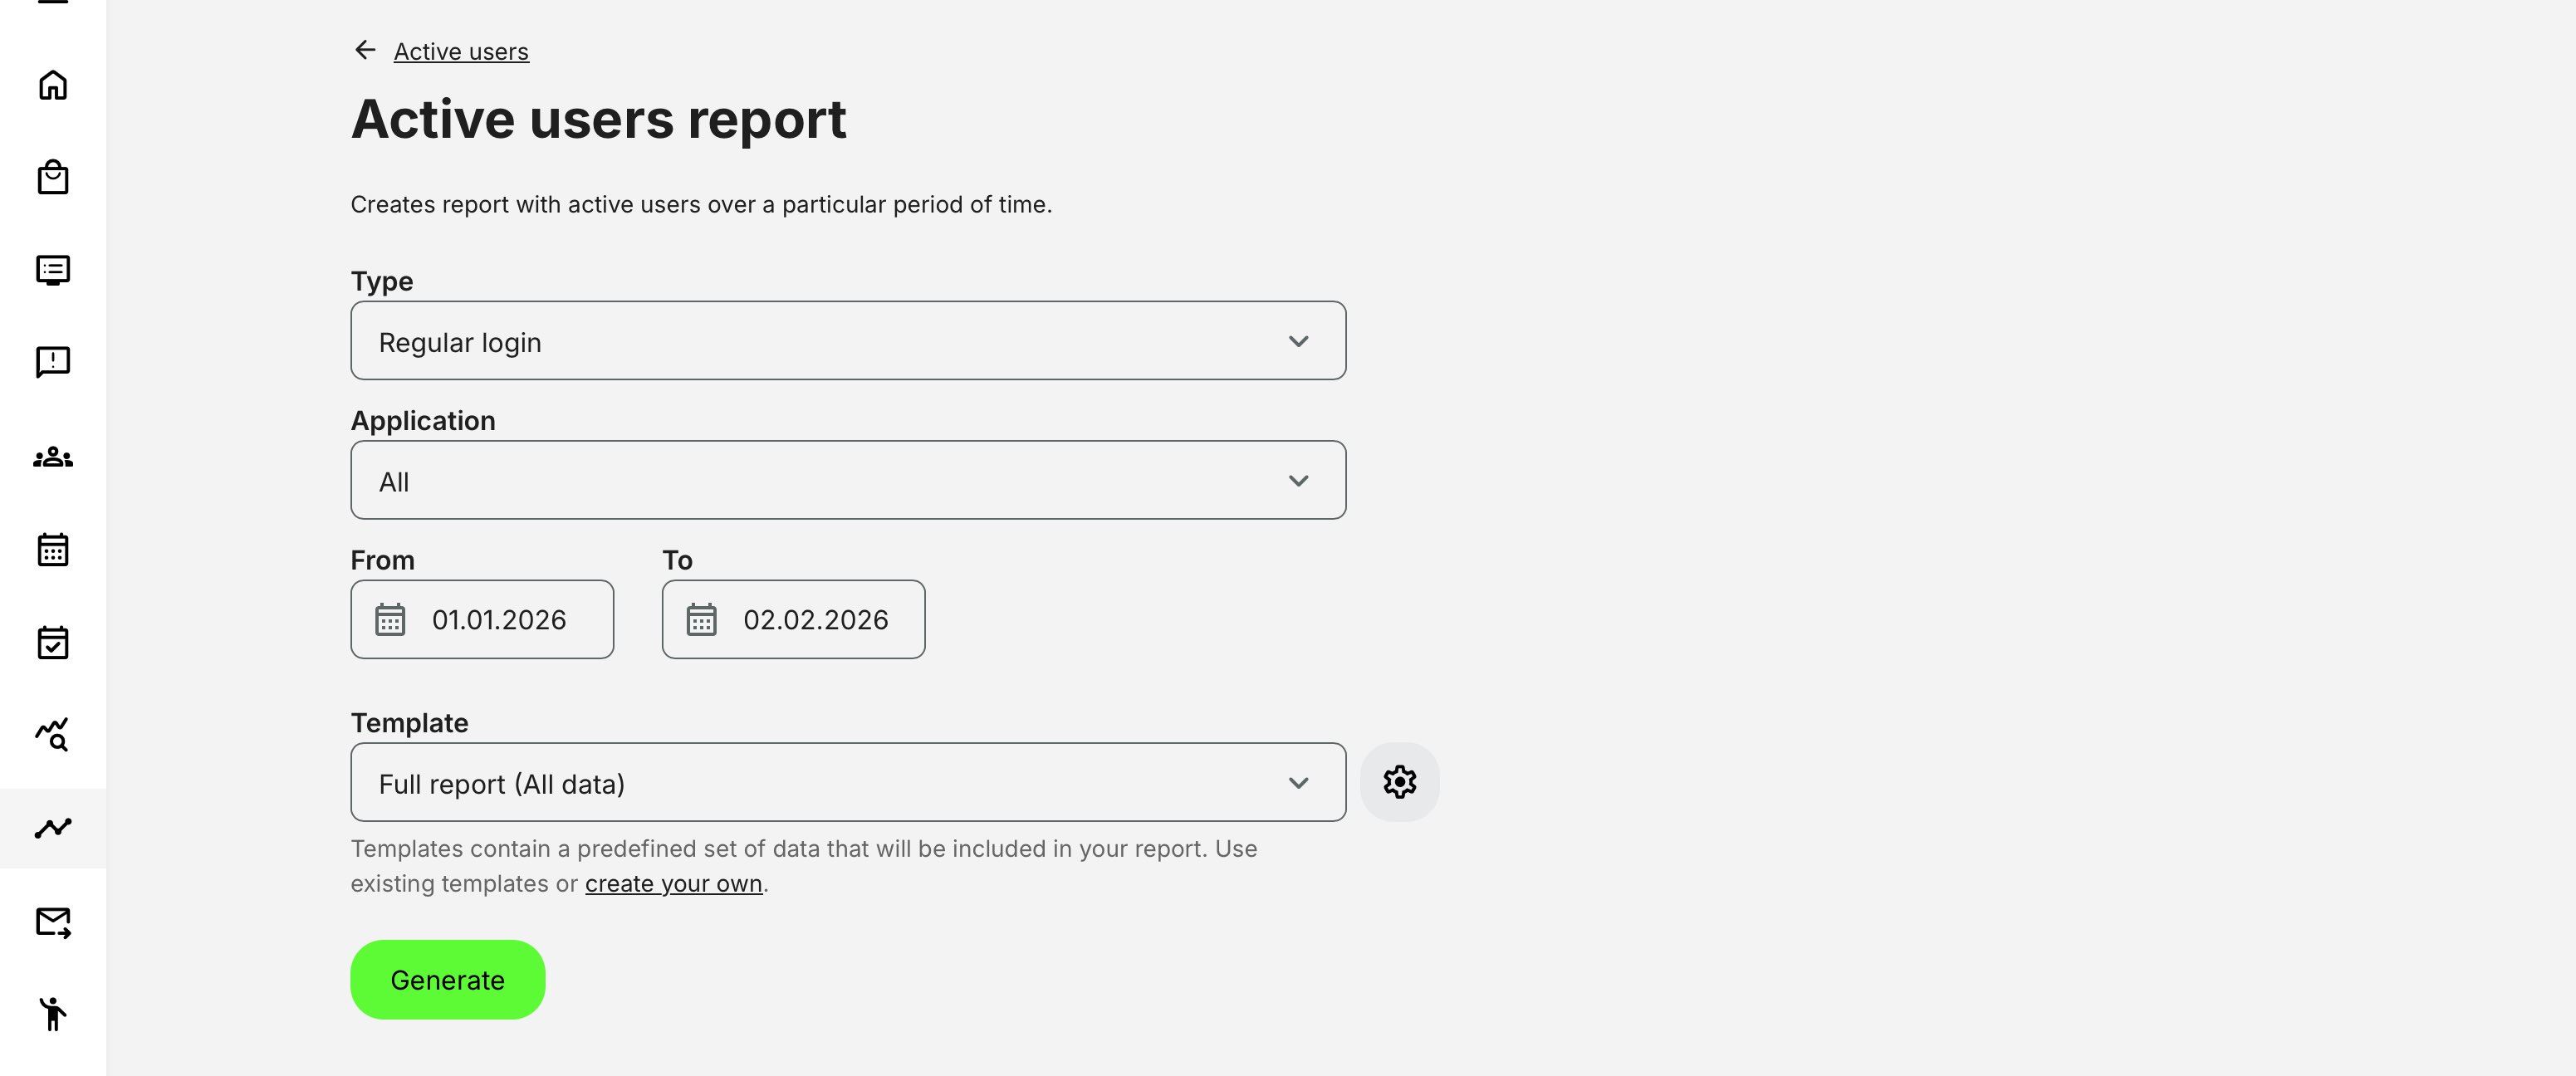
Additional Details Available in the Active Users Report
While the Active Users analytics visuals provides high-level insight through counters, charts, and breakdowns, the Active Users report offers a deeper, record-level view of user activity. This makes it especially useful for audits, license tracking, compliance checks, and external analysis.
The report expands on the visual analytics by exposing detailed user-level data, login context, and activity interaction—exportable for further processing or integration with external systems.
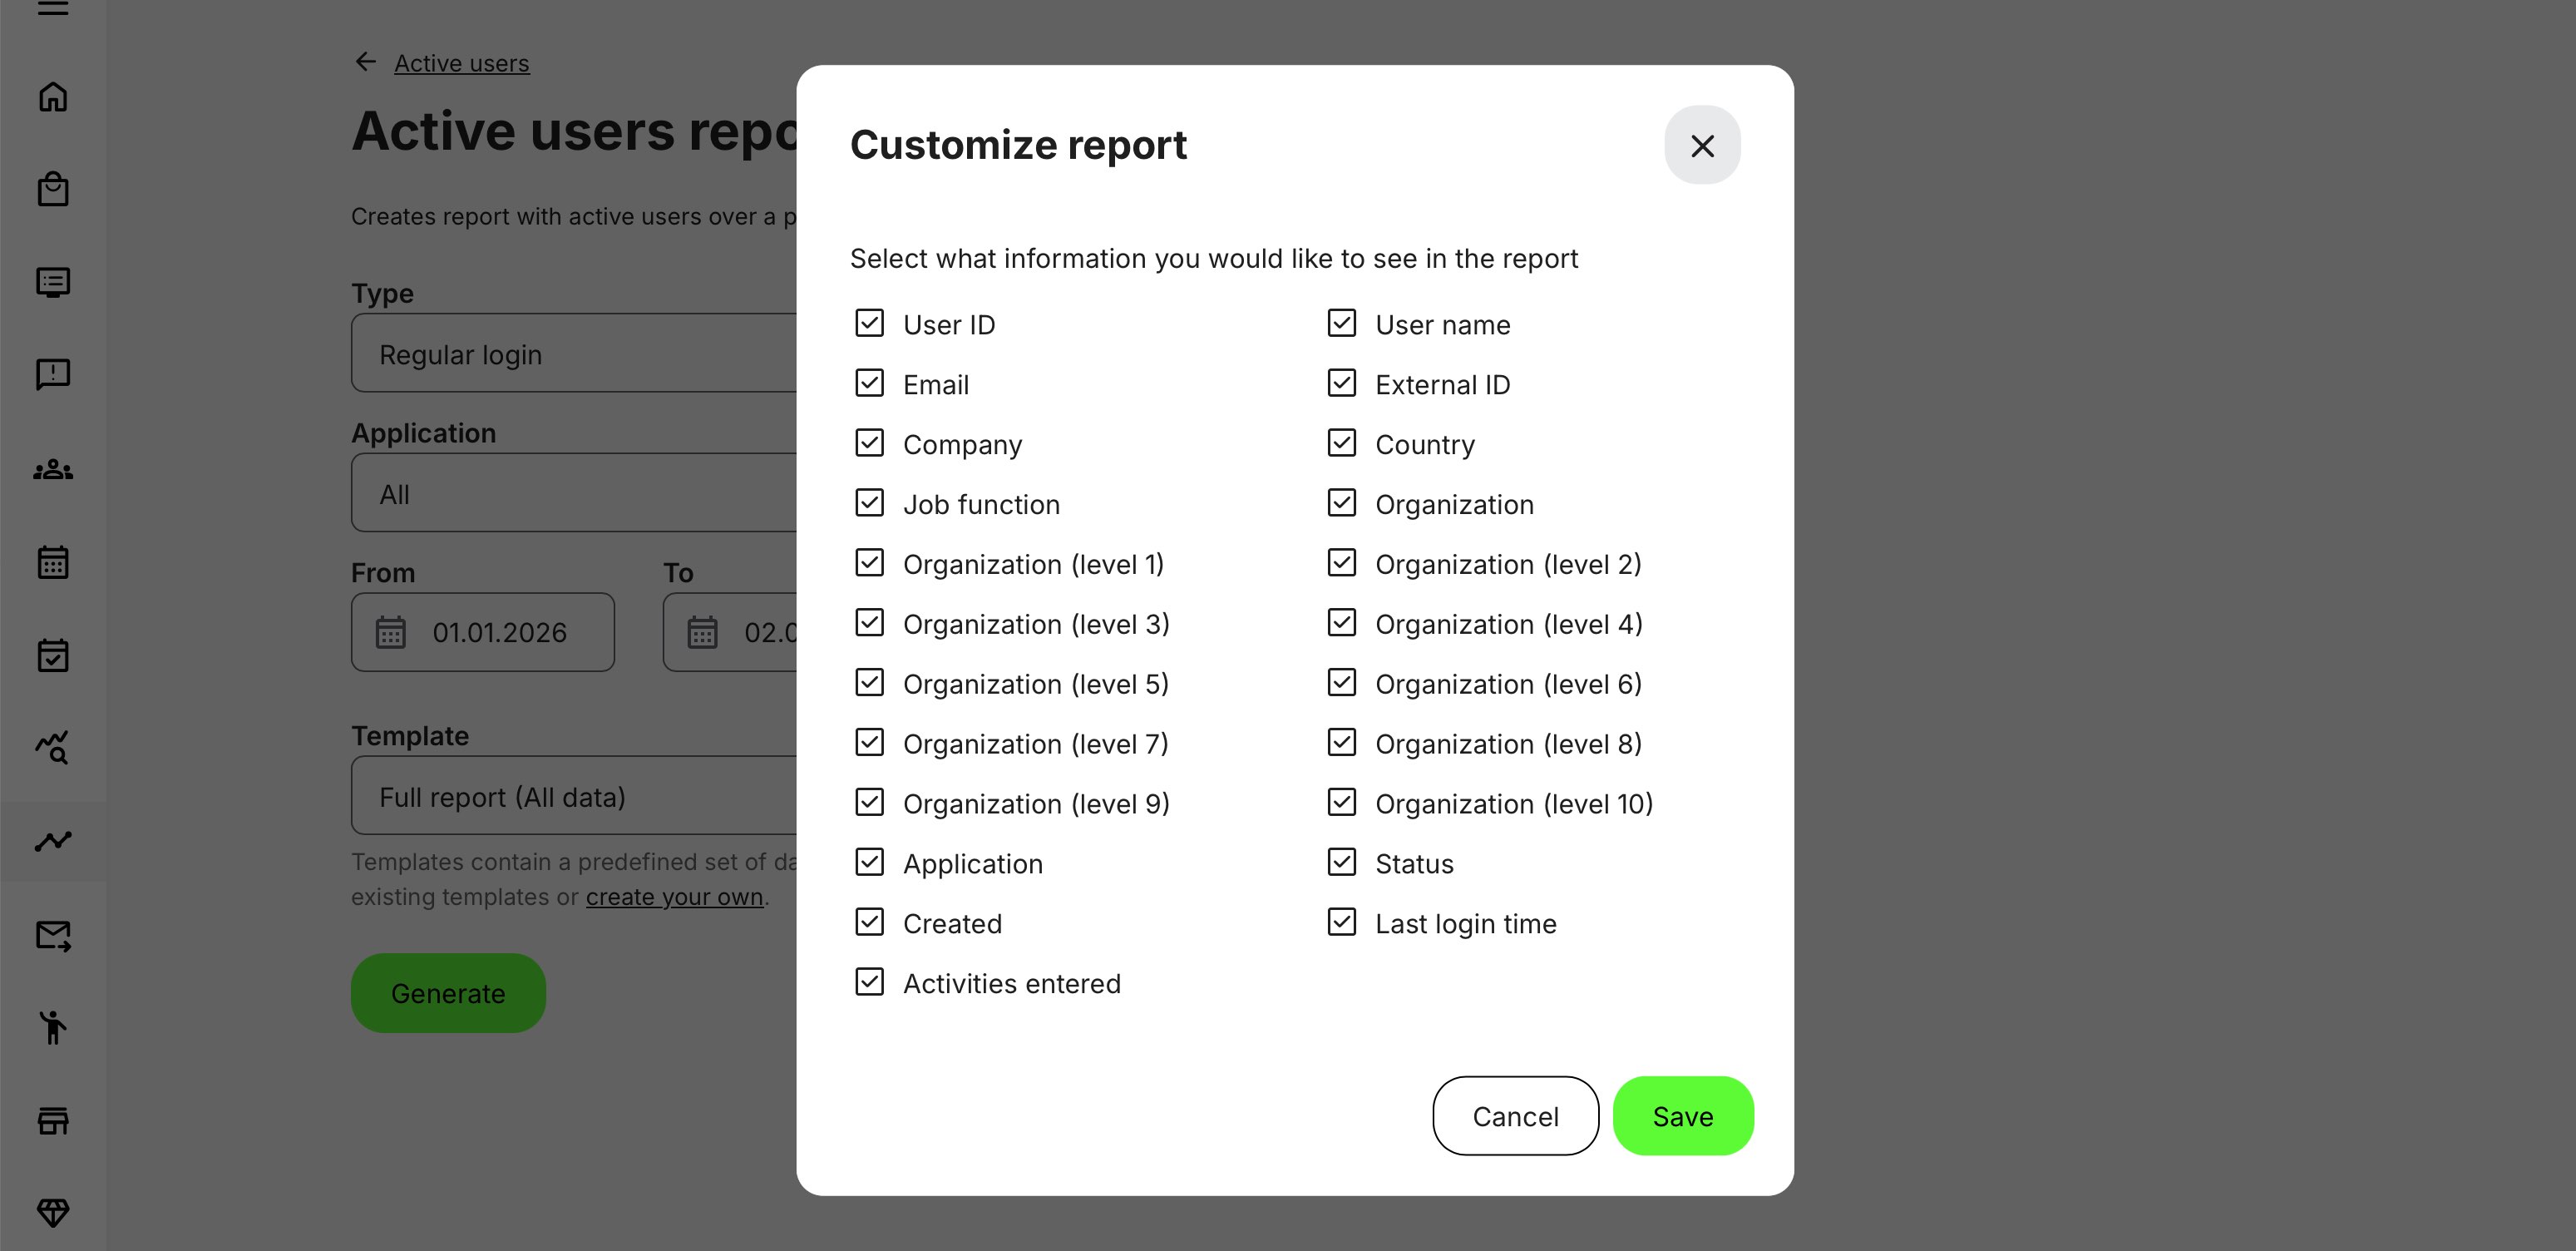
The Active Users report includes row-level data per user login period, allowing administrators to understand who was active, how they accessed the platform, and what they interacted with.
| Data Area | What Is Included | Why It Matters |
|---|---|---|
| User & Identity Data | User ID and external ID, full name, email, company, country, job function, and current account status (active, deleted, etc.) captured at time of login. | Provides clear identification and accountability for each active user while supporting audits, licensing checks, and operational follow-up. |
| Deleted User Handling | For deleted users, only limited fields are retained (User ID, account status, registration date, last login) in line with GDPR retention rules. | Preserves historical usage accuracy without exposing personal data beyond compliance requirements. |
| Organization Context at Login | Organization and sub-organization as they existed at the moment of login (not updated to later profile changes). | Ensures historical accuracy for usage validation, licensing, and organization-based access audits. |
| Login Method & Channel | Login type (regular login or QR code), application used (Web or Mobile for regular logins), login timestamp, last login time. | Enables analysis of access patterns, device usage, and channel adoption. |
| Counting Logic | Each user is counted once per period per login method. | Aligns analytics with license-style usage logic while maintaining granular visibility. |
| Activities Entered During Period | List of training activities the user actively interacted with during the timeframe | Provides concrete evidence of engagement beyond simple login activity |
| Activity Interaction Rules | Activities are included when the user viewed course pages, was marked attended at events, or created/edited assignment submissions | Ensures that reported activity reflects real learner interaction |
| Group Assignment Attribution | Activities appear only if the learner personally interacted, not when group members acted on their behalf | Maintains precise attribution of engagement and avoids inflated activity counts |
An optional configuration allows administrators to include the full organization tree (across multiple levels) in the exported file, providing structural clarity for complex hierarchies. Reach out to the Eurekos Service Desk for this advanced configuration.
Permissions, Data Access, and Organization Layer
Active Users Analytics is governed by role-based permissions and the organization layer. Users can only see data they are authorized to access based on their role, organizational affiliation, and scope of responsibility.
In practice:
- Data visibility is limited to permitted organizations, activities, and entities
- Parent organizations can see aggregated sub-organization data; sub-organizations cannot see upward or sideways
- Blocked users remain visible for historical accuracy; deleted users are excluded for privacy compliance; Cancelled and expired enrollments remain visible for audit and traceability
- The same rules apply consistently to both on-screen analytics and exported reports
This ensures secure, consistent, and audit-ready access to data across the platform.
Relationship to Licensing and Compliance
Because the Active Users report mirrors license-style counting logic, it is commonly used for:
- Contractual usage validation
- Internal audits
- External reporting and reconciliation
- BI system ingestion
Combined with export capabilities and API access, the report serves as a reliable bridge between Eurekos analytics and enterprise-level data ecosystems.
Analytics vs. Report
Analytics dashboards show what is happening now and how it is trending over time, while reports provide precise answers to who did what, when, and in which organizational context.
Together, they combine strategic visibility with operational certainty—supporting daily monitoring, audits, and downstream BI or reporting needs.
| Dimension | Active Users Analytics (Charts) | Active Users Report (Export) |
|---|---|---|
| Purpose | High-level monitoring and trend analysis | Detailed, record-level analysis and validation |
| Primary use case | Operational oversight, usage trends, quick insights | Audits, licensing validation, compliance, external reporting |
| Data granularity | Aggregated counts and percentages | Individual user and login-level rows |
| Time perspective | Visual trends by month or quarter | Exact timestamps within a defined period |
| User visibility | Based on viewer’s organization access and permissions | Same access rules, but with full row-level detail |
| Unique users | Displayed as counters and bar charts | Explicit user records with email and user ID |
| Login types | Visual breakdown (Regular, Mobile, QR) | Explicit fields per login record |
| Mobile vs. Web | Shown as percentages | Explicit application field (Web / Mobile) |
| QR code usage | Included in counts and bars | Clearly marked per login record |
| Organization context | Grouped summaries by organization | Organization at time of login preserved per user |
| Sub-organization logic | Reflected in charts and breakdowns | Preserved in exported organization hierarchy |
| Activities entered | Not visible | Explicit list of activities entered during the period |
| Deleted users | Included in aggregates | Included with limited, compliant fields |
| Deleted organizations | Shown with visual indicators (blurred/greyed) | Labeled with [DELETED] for traceability |
| Filtering | Interactive filters (Login type, Country, Organization) | Filtered at report generation time |
| Real-time interaction | Yes (dynamic charts and filters) | No (static export) |
| Export capability | Indirect (via “Get report”) | Direct export for Excel / BI tools |
| Performance focus | Fast visual summaries | Optimized for large datasets and audits |
| Typical audience | Admins, managers, executives | Admins, auditors, compliance, BI teams |
| Best used when | You want to understand trends quickly | You need to prove, reconcile, or integrate data |