Courses Report - Article
Summary
The Courses report tracks course creation over time, including production volume, authorship, language, and tags. It helps administrators monitor content growth, support planning discussions, and maintain governance of the learning portfolio across teams and regions.
In this article you will learn:
- How the Courses report tracks course creation across a selected period
- How course data supports planning, governance, and portfolio growth discussions
- How authorship, language, and tags appear in course reporting
- How the report helps monitor content development over time
What the Courses Report Is Used For
As learning platforms mature, organizations naturally ask questions such as:
- How many courses do we currently have?
- How many new courses were produced this quarter?
- Are we meeting our content development targets?
- Which teams, authors, or regions are contributing most to the learning library?
The Courses Report answers these questions by providing a time-based view of course creation across the platform. Rather than focusing on learner behavior, this report focuses on content production itself—making it especially valuable for:
- Learning operations and platform governance
- Content planning and roadmap tracking
- Authoring productivity and ownership visibility
- Executive or stakeholder reporting on learning portfolio growth
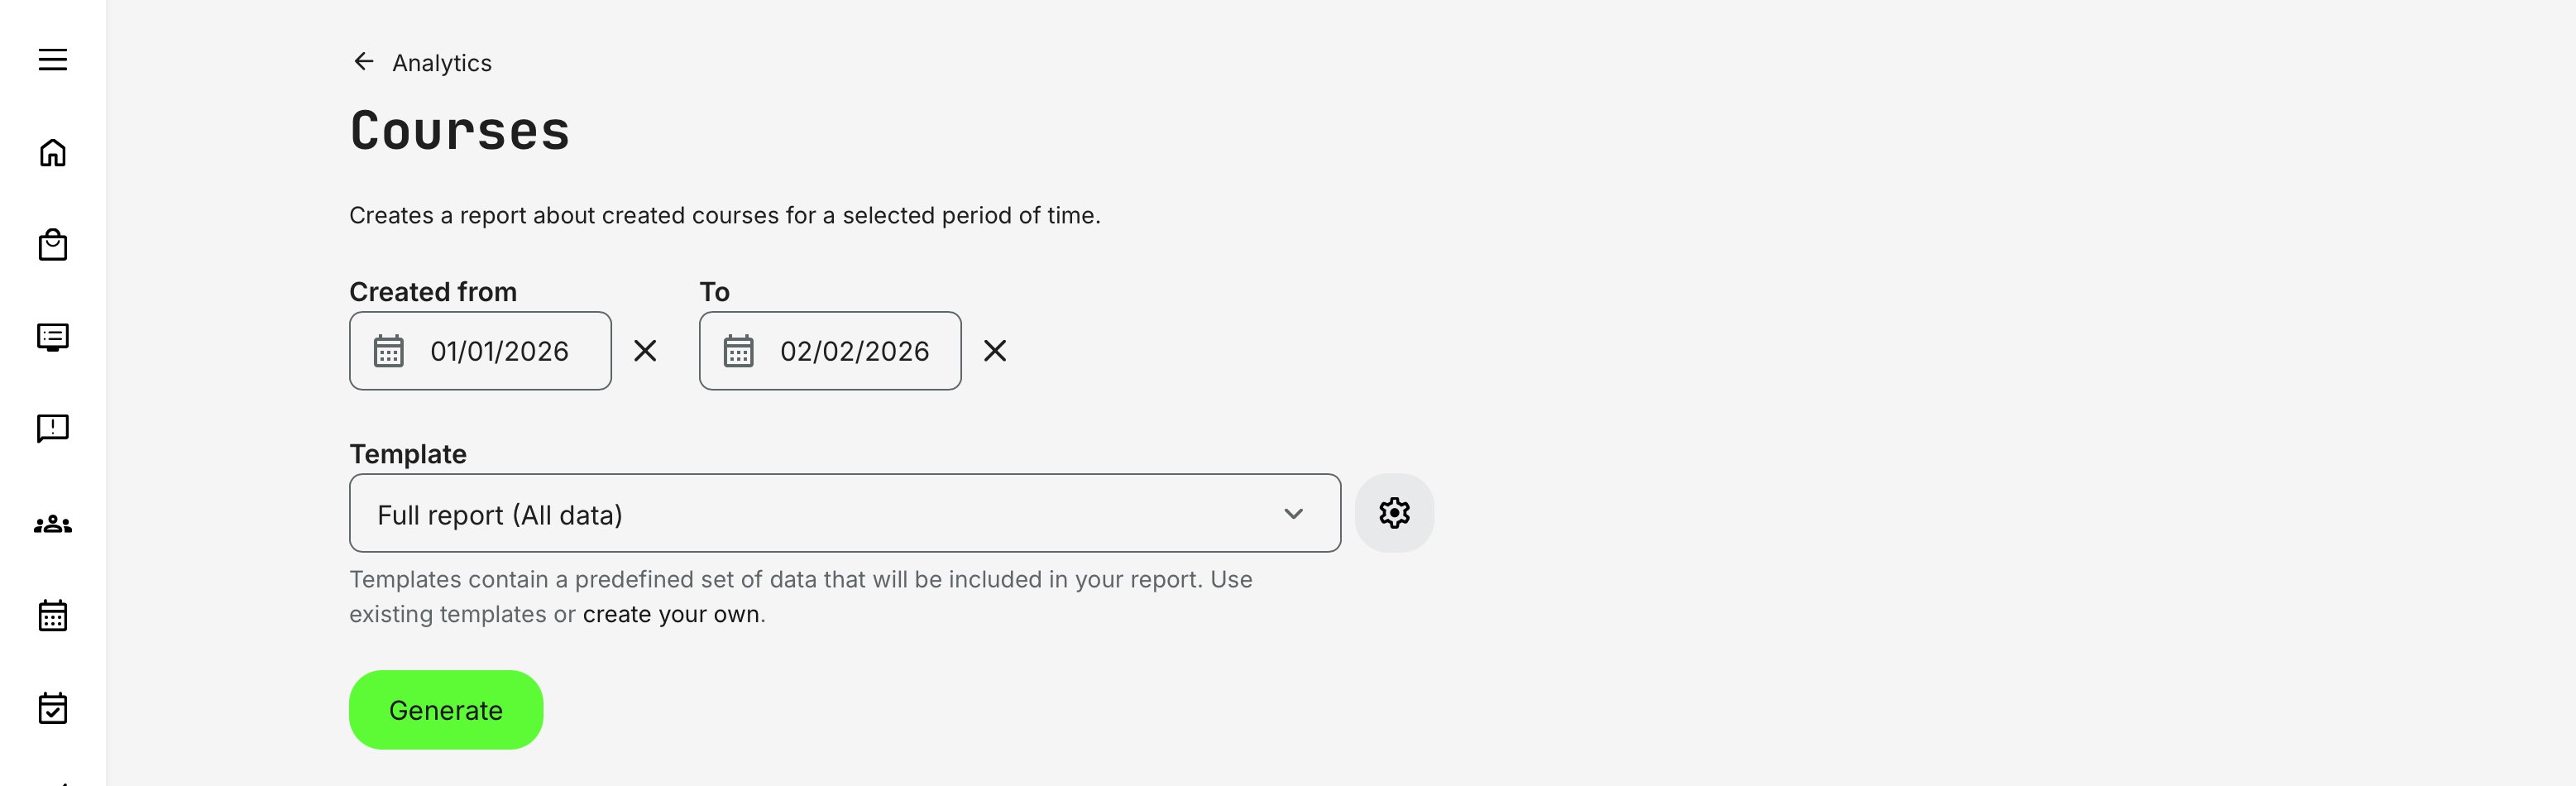
Report Form and Time Scope
When generating a Courses Report, you select:
- Created from date
- Created to date
- Template (Full report or a custom template)
Only courses created within the selected time window are included. Updates made after creation do not affect inclusion—this report is strictly creation-based, making it ideal for quarterly or annual production tracking.
What Data the Courses Report Contains
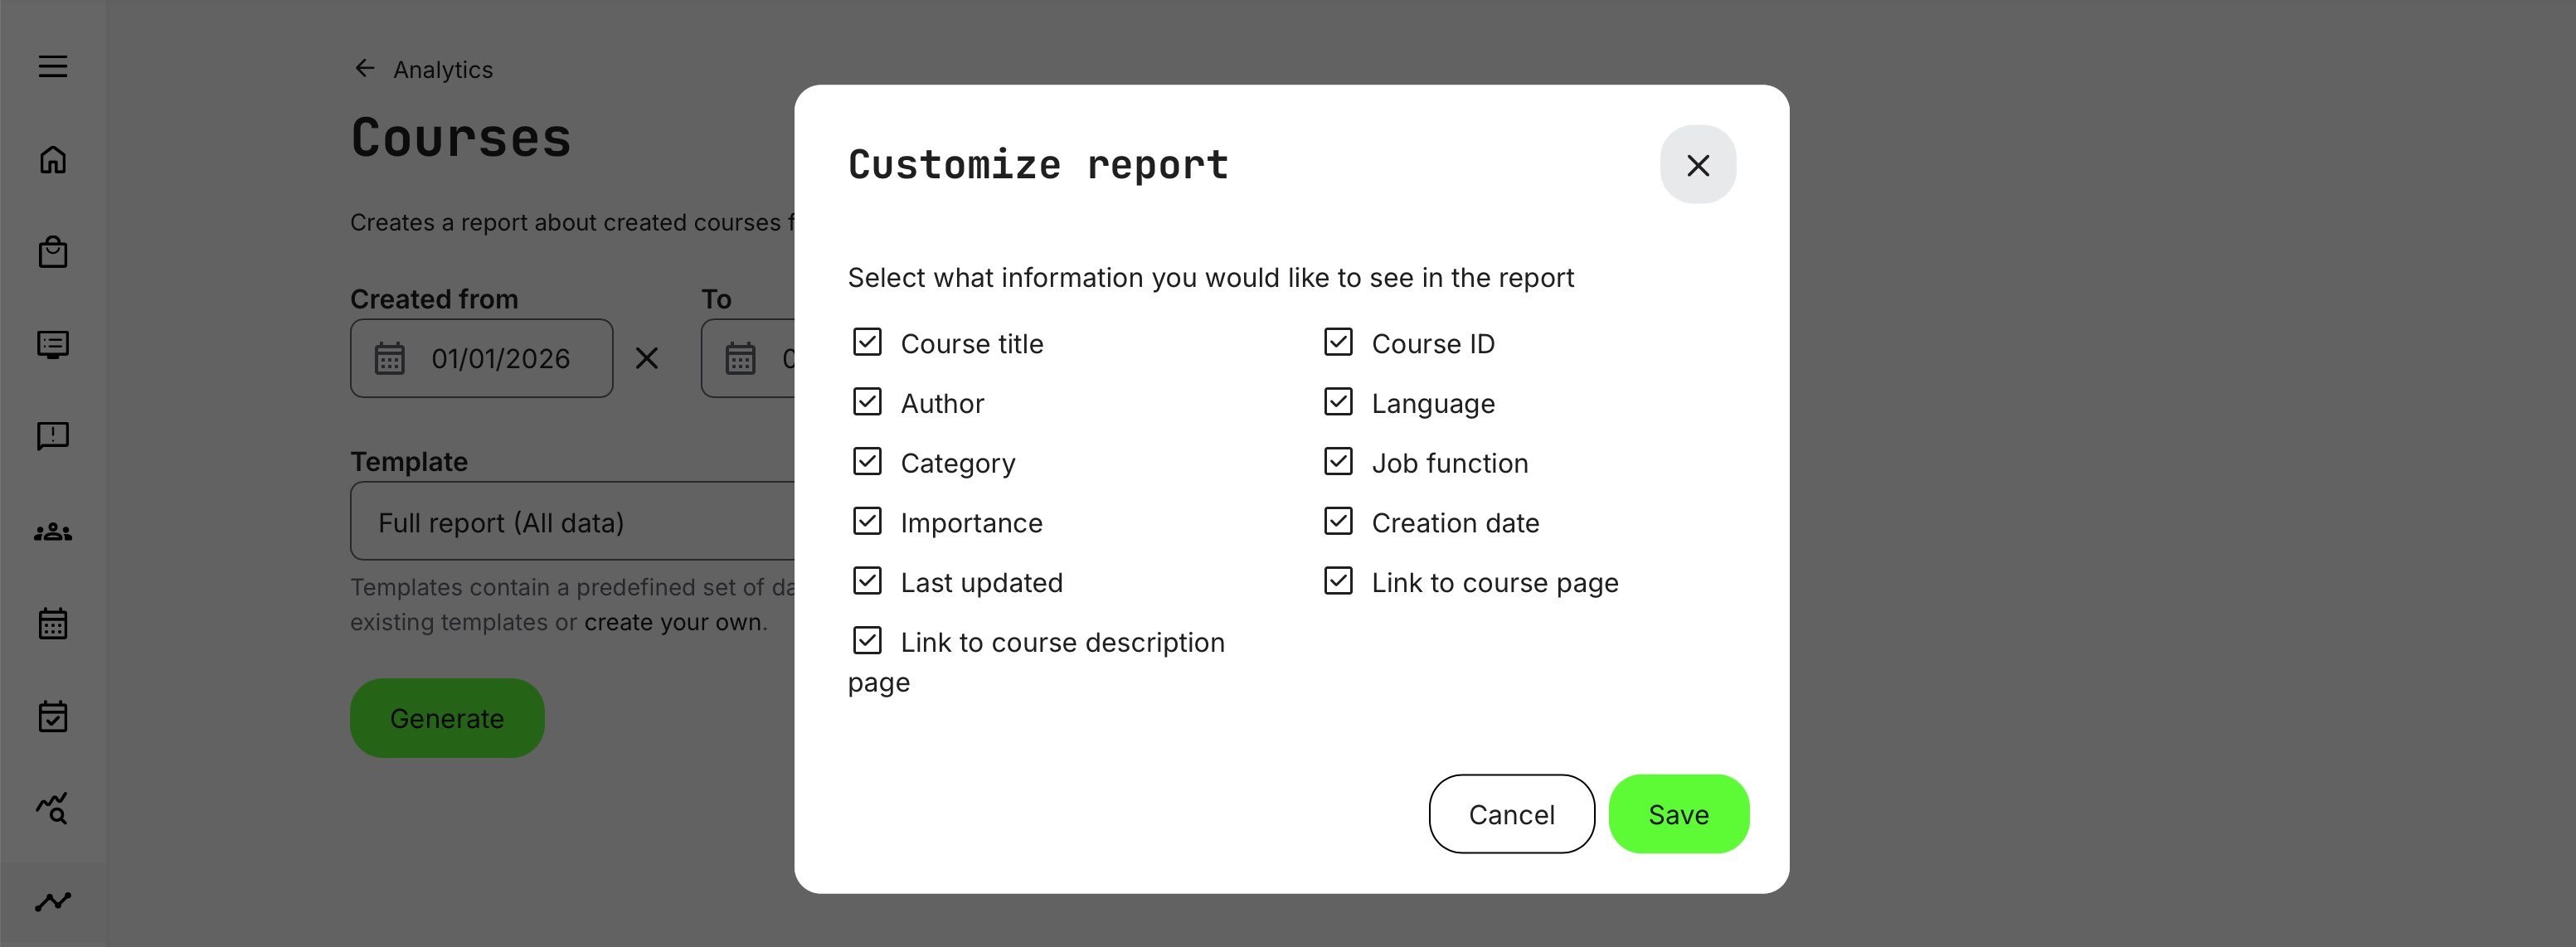
The report includes one row per course, limited to courses created within the selected time period. Data fields included are described in the table below.
| Field | Description |
|---|---|
| Course title | The official name of the course as displayed in the platform |
| Course ID | A unique identifier used to reference the course unambiguously across reports, exports, and integrations |
| Author | The full name of the user who created or owns the course |
| Language | The primary language the course is tagged with, based on the platform’s language configuration |
| Tags | All tags associated with the course, such as category, department, job function, or other taxonomies configured at the course level. These enable filtering and segmentation in analytics |
| Creation date | The date and time when the course was originally created |
| Last updated date | The date and time of the most recent update to the course content or configuration |
| Course link | A direct URL to the course itself. Standard access permissions apply |
| Course description link | A direct URL to the course description page for quick review of the learning offer. Standard access permissions apply |
Together, these fields support operational reporting, content governance, and planning—making it easy to track course inventory, authoring activity, and content lifecycle status across the organization.
Permissions, Data Access, and Organization Layer
The Courses Report is governed by role-based permissions and the organization layer. Users can only see data they are authorized to access based on their role, organizational affiliation, and scope of responsibility.
In practice:
- Data visibility is limited to permitted organizations, activities, and entities
- Parent organizations can see aggregated sub-organization data; sub-organizations cannot see upward or sideways
- Blocked users remain visible for historical accuracy; deleted users are excluded for privacy compliance; Cancelled and expired enrollments remain visible for audit and traceability
- The same rules apply consistently to both on-screen analytics and exported reports
This ensures secure, consistent, and audit-ready access to data across the platform.
Use Case
A learning organization operates with a quarterly content roadmap aligned to product releases, regulatory updates, and regional enablement needs. At the end of each quarter, the learning operations team runs the Courses Report with the date range set to the last three months.
From this report, they can quickly see:
- How many courses were produced versus the planned target
- Which departments or authoring teams delivered content on time
- Which languages and regions were covered—and where gaps remain
- Whether production was evenly distributed or concentrated in a few areas
For example, the report may show that most new courses were created for one product area and in a single language, while other planned initiatives were delayed. This allows the team to adjust the next quarter’s roadmap—reallocating authoring resources, prioritizing localization, or postponing lower-impact initiatives.
Because the report reflects actual course creation dates, it provides an objective baseline for planning discussions. Rather than relying on estimates or project updates, stakeholders can anchor decisions in verified platform data—supporting more realistic targets, better forecasting, and improved accountability for the next planning cycle.