Questionnaires Analytics and Report - Article
Summary
Questionnaires Analytics and Report provides insight into questionnaire responses across surveys and intake forms. It helps administrators analyze feedback trends, review individual responses, and export structured data for reporting and follow-up workflows.
In this article you will learn:
- How questionnaire responses appear in analytics and reports
- How administrators analyze response patterns and feedback trends
- How questionnaire data can be exported for reporting
- How analytics supports follow-up actions and process automation
Purpose and Scope
Questionnaires are used throughout Eurekos to collect structured input from users—ranging from training feedback and assessments to enrollment approvals, onboarding confirmations, and regulatory consents. Unlike activity-specific reports, Questionnaires Analytics and Report operate across everything: activities, buttons, URLs, onboarding rules, automated emails, and enrollment flows.
This makes them especially valuable for administrators and learning owners who need to answer questions such as:
- Are users responding where we expect them to?
- Which questionnaires are actively used, and in which contexts?
- What are the response rates and patterns across audiences, regions, or programs?
- Can we document consent, feedback, or decisions for audits and governance?
Analytics focuses on what is happening right now and how it trends, while reports provide exact, respondent-level evidence for follow-up, audits, and external analysis.
Questionnaires Analytics Overview
The Questionnaires Analytics area lists all questionnaires on the platform that you are authorized to see. From here, you can:
- Search questionnaires by title
- Filter by time frame (creation date)
- Filter by usage type and subtype (see below)
- Open a questionnaire to review detailed analytics
- Navigate directly to the Questionnaire Report
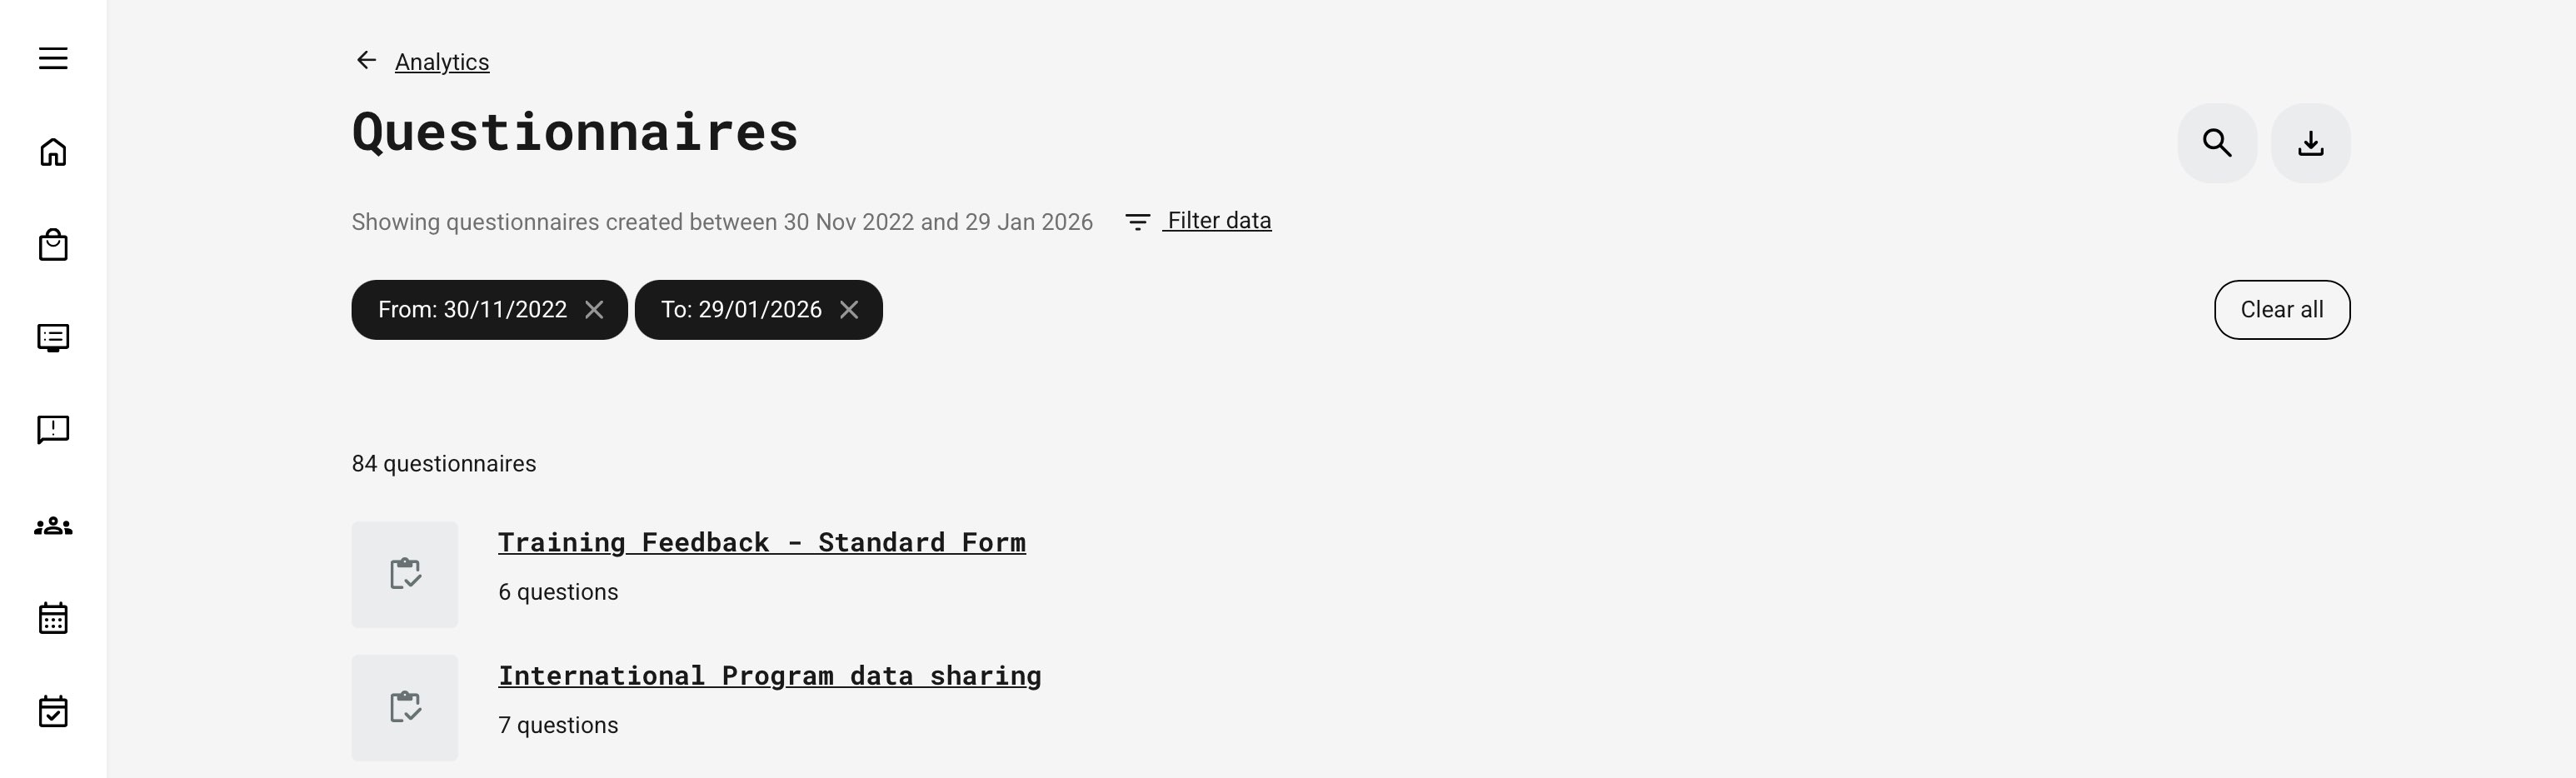
Only questionnaires with at least one recorded response are included in analytics. Responses from blocked users are included, while responses from deleted users are excluded. Cancelled and expired signups are still reflected in the data. Questionnaires that have been deleted from the platform are excluded from analytics.
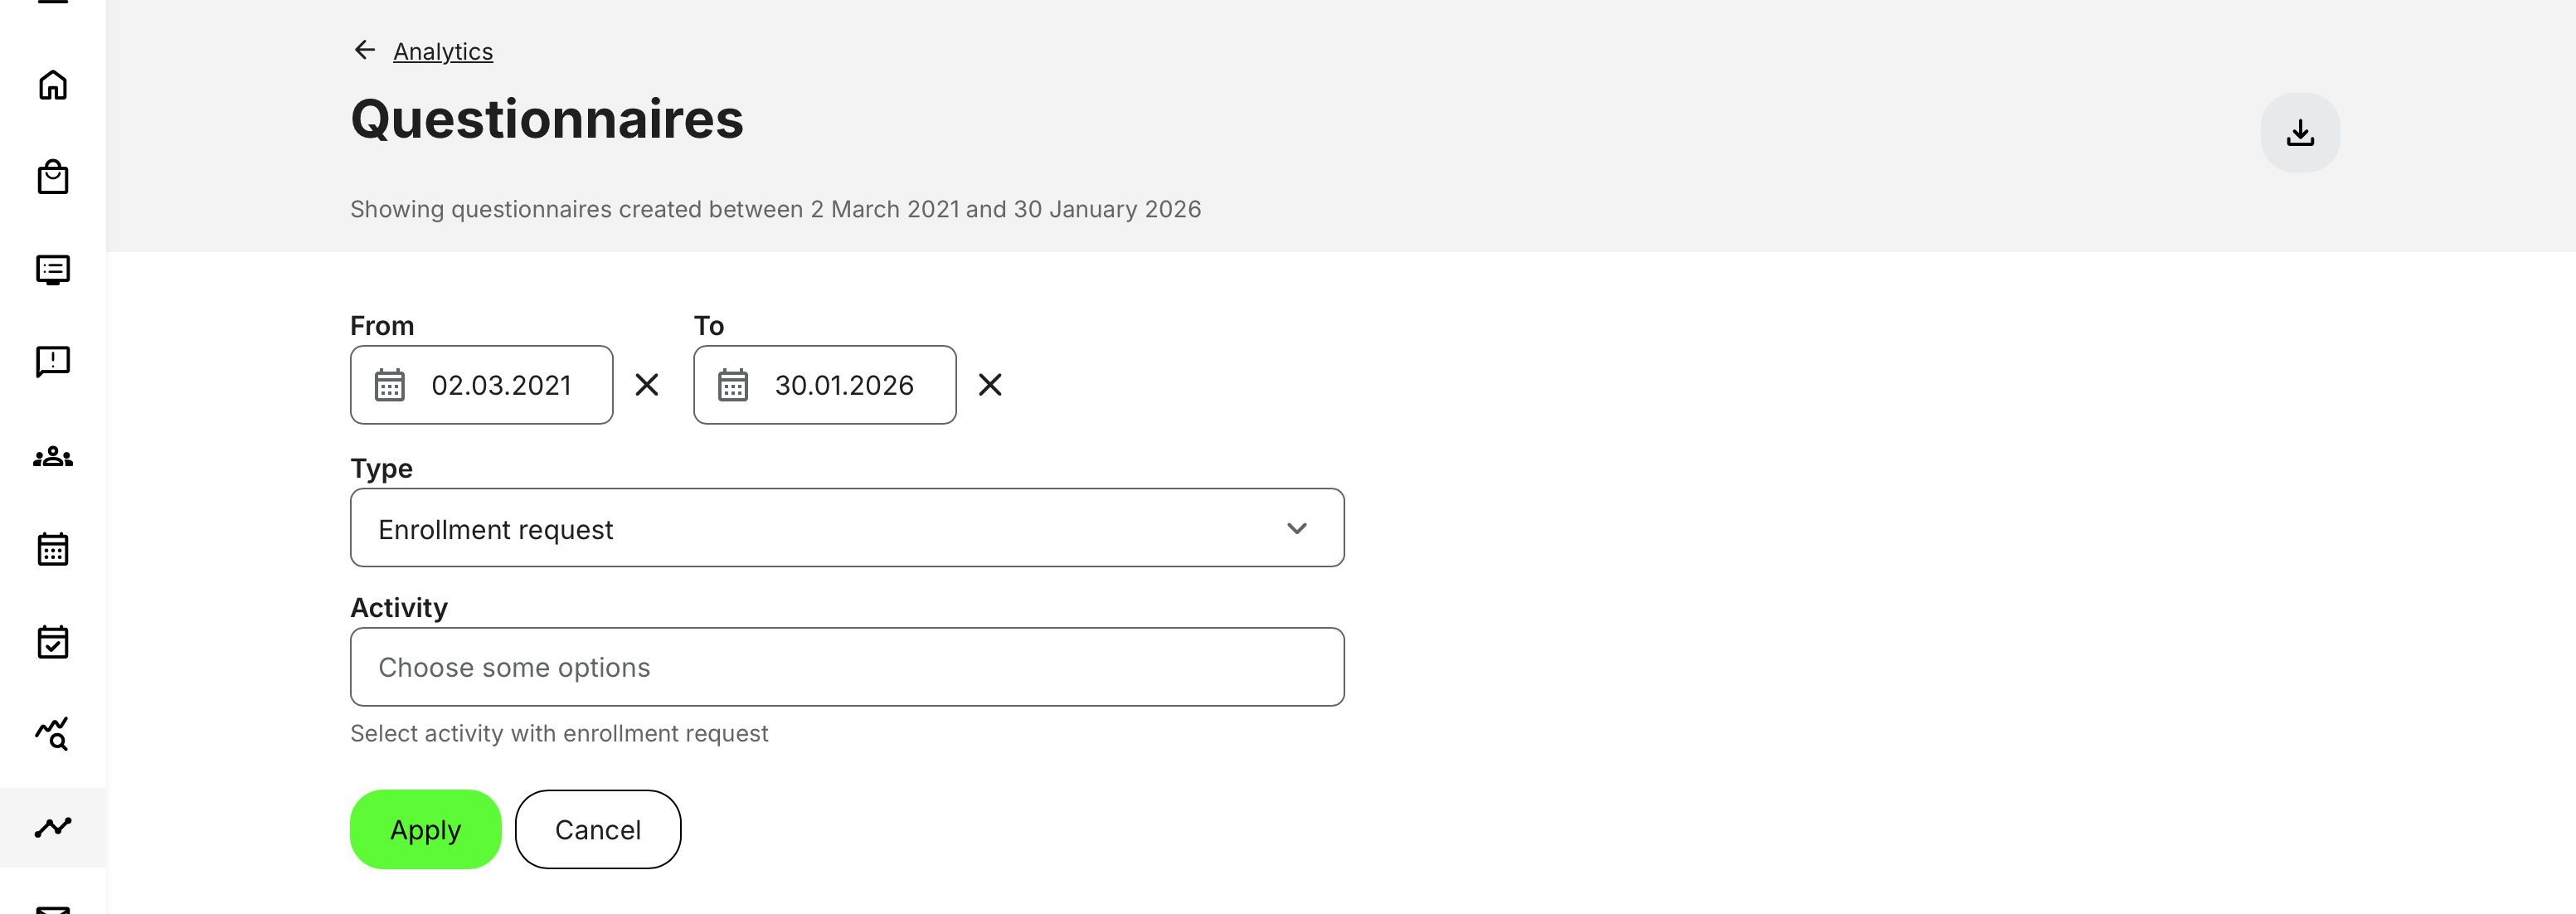
Filtering and Usage Context
A single questionnaire can be reused in multiple contexts across the platform. Filtering allows you to segment analytics by usage type and context, making it possible to analyze responses accurately even when the same questionnaire is used in different flows.
- Time frame (based on questionnaire creation date)
- Type of usage, including:
- Activity (feedback or embedded feature)
- Button widget
- Enrollment request / approval
- Enrollment request confirmation
- On-demand access
- Onboarding rule
- URL-based access
- Automated email actions
A questionnaire appears in the list if it has at least one reply in the selected usage context. Subtypes are shown dynamically based on available data.
Questionnaire-Level Analytics
When you open a specific questionnaire, analytics aggregate all answers given to that questionnaire, regardless of where it was used.
Top-Level KPIs
Each questionnaire shows:
- Number of questions
- Number of responses (each submission counts, including repeat submissions)
- Used in (all places where the questionnaire appears)
- Response rate (where applicable)
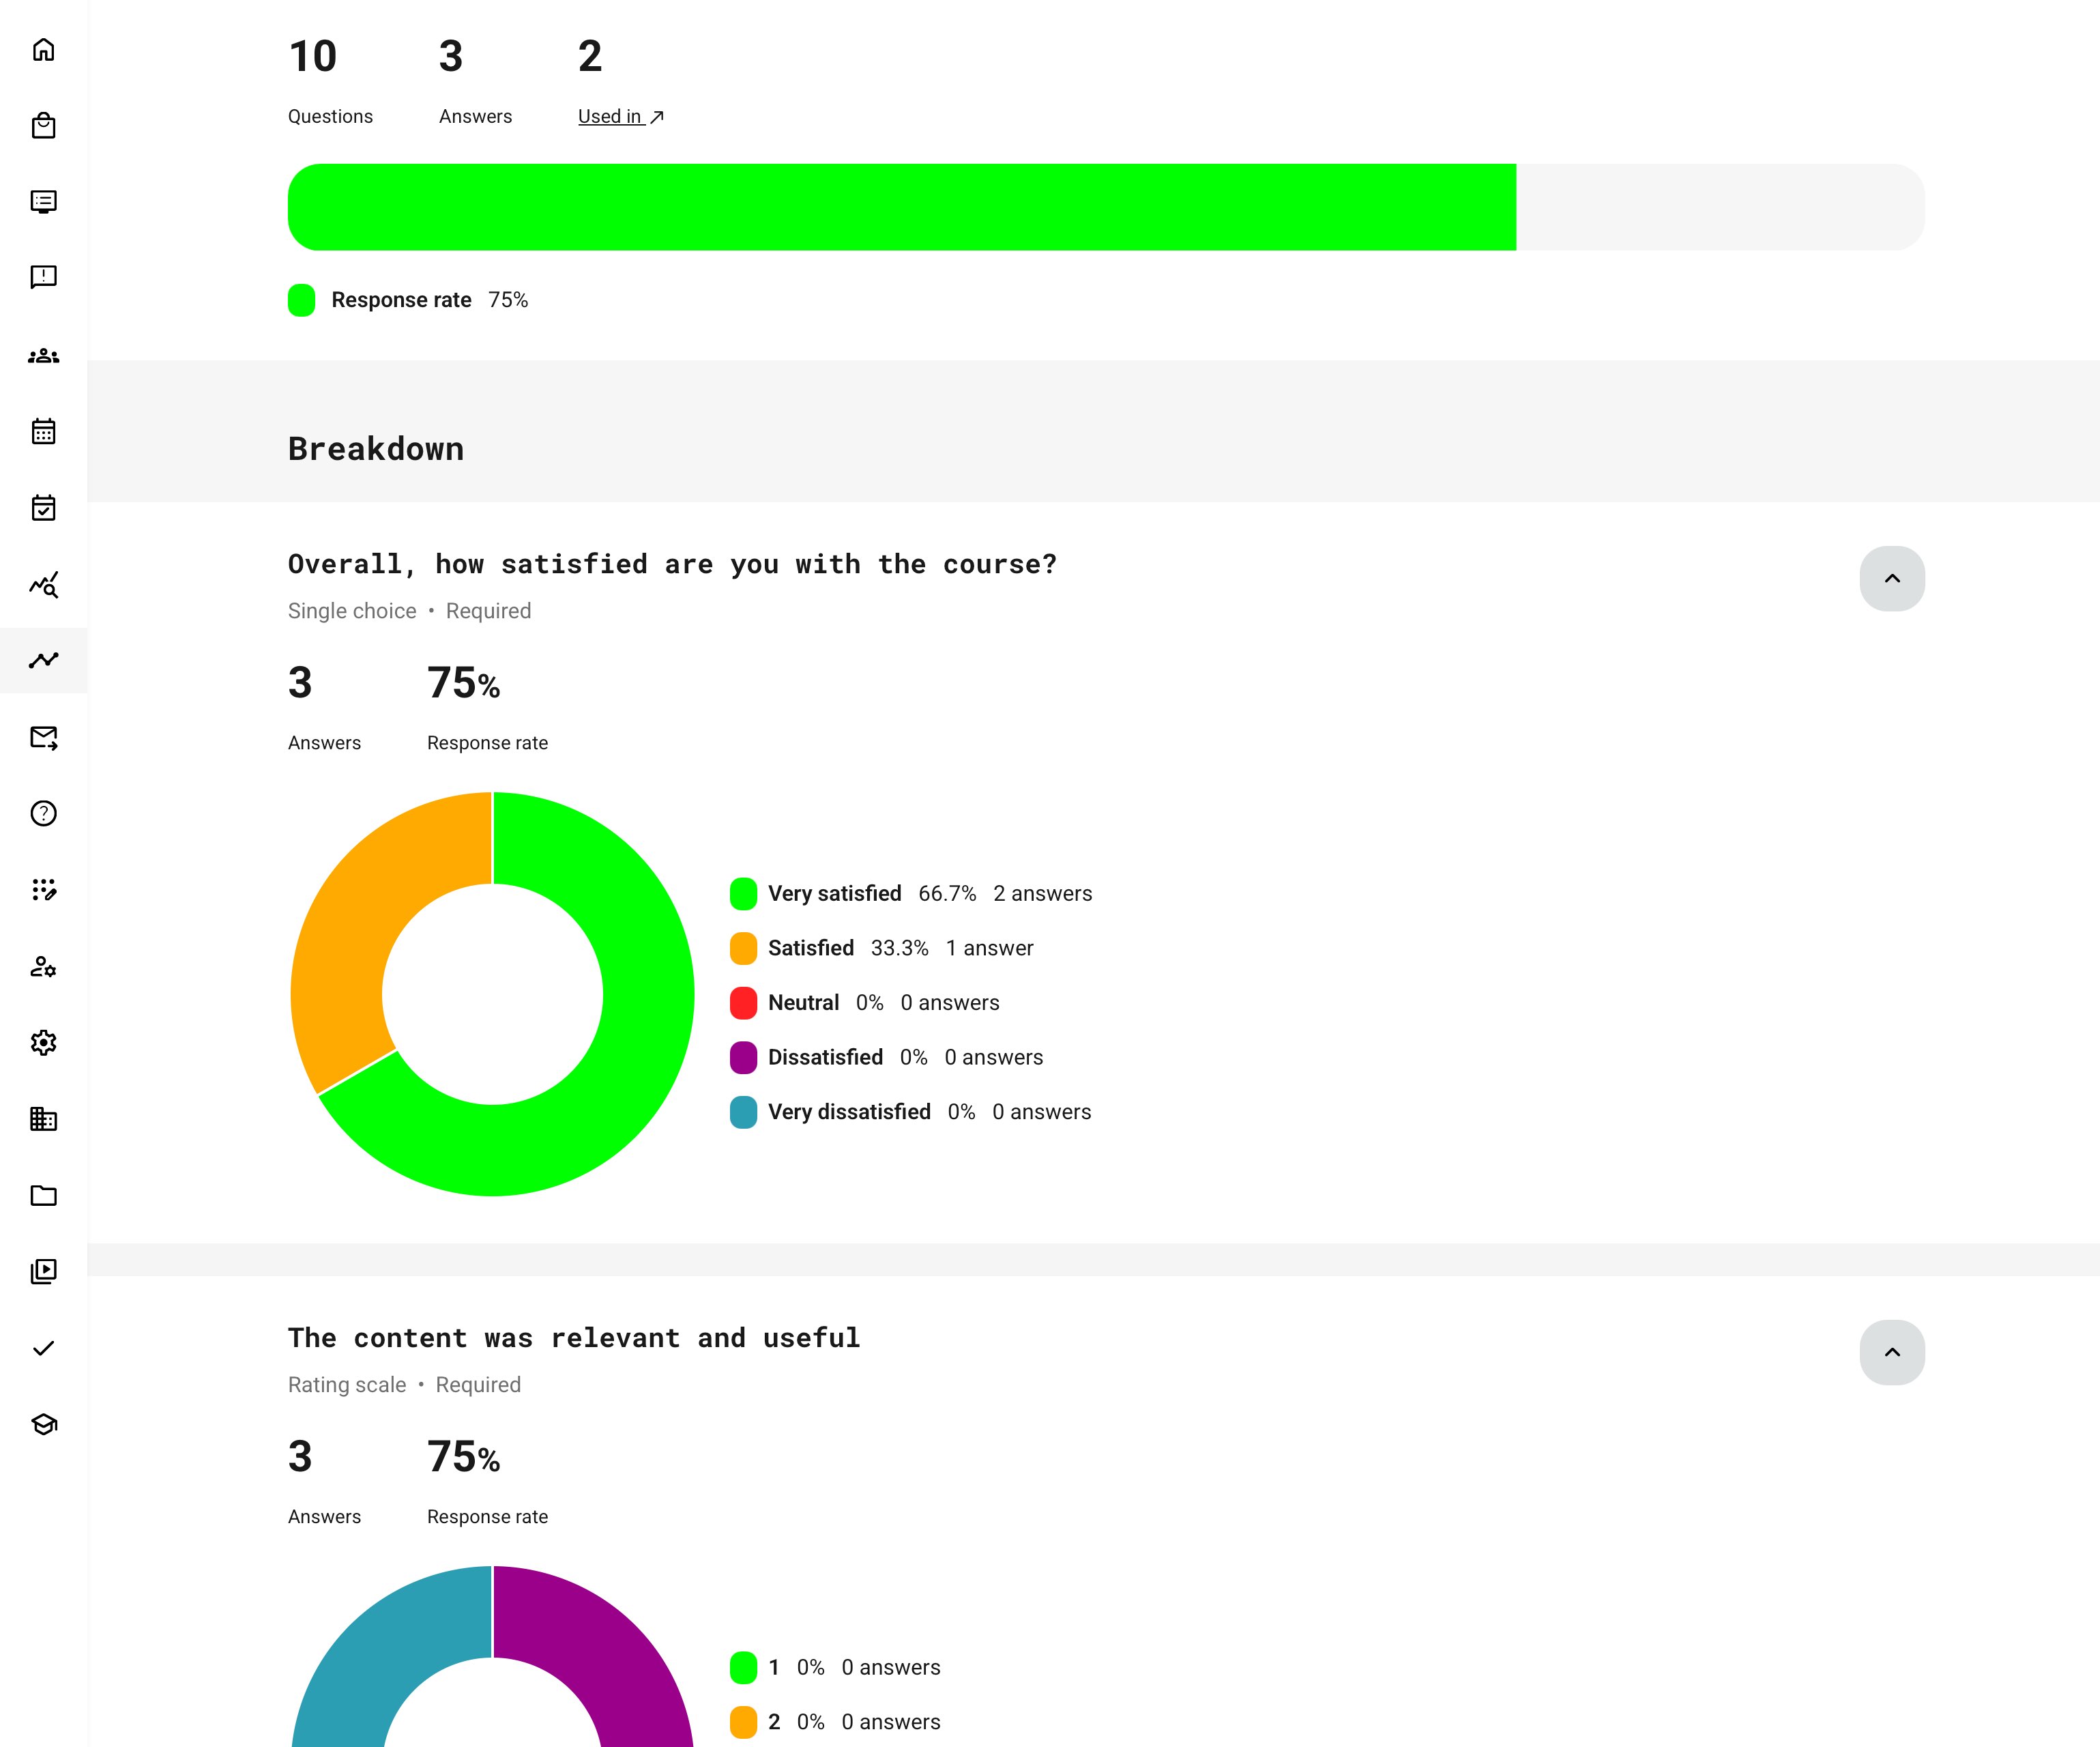
Questionnaires Analytics — Response Rates, Breakdowns, and Visualizations
This overview explains how questionnaire responses are calculated and presented in analytics. It shows how audiences are defined, how response rates are derived, and how different question types are visualized—helping you quickly understand participation levels, engagement patterns, and where deeper analysis may be needed.
| Area | What It Means | Key Details |
|---|---|---|
| Response Rate | Measures engagement relative to the potential audience | Calculated as the percentage of replies compared to the total audience for the questionnaire |
| Audience Definition | Audience size depends on how the questionnaire is used |
|
| Multiple Usage Contexts | Same questionnaire used in more than one place | Audiences are summed across all usage contexts to calculate overall response rate |
| Question Breakdown | Analytics shown per individual question | Excludes headings, dividers, and text-only blocks |
| Question-Level Metrics | What is shown for each question |
|
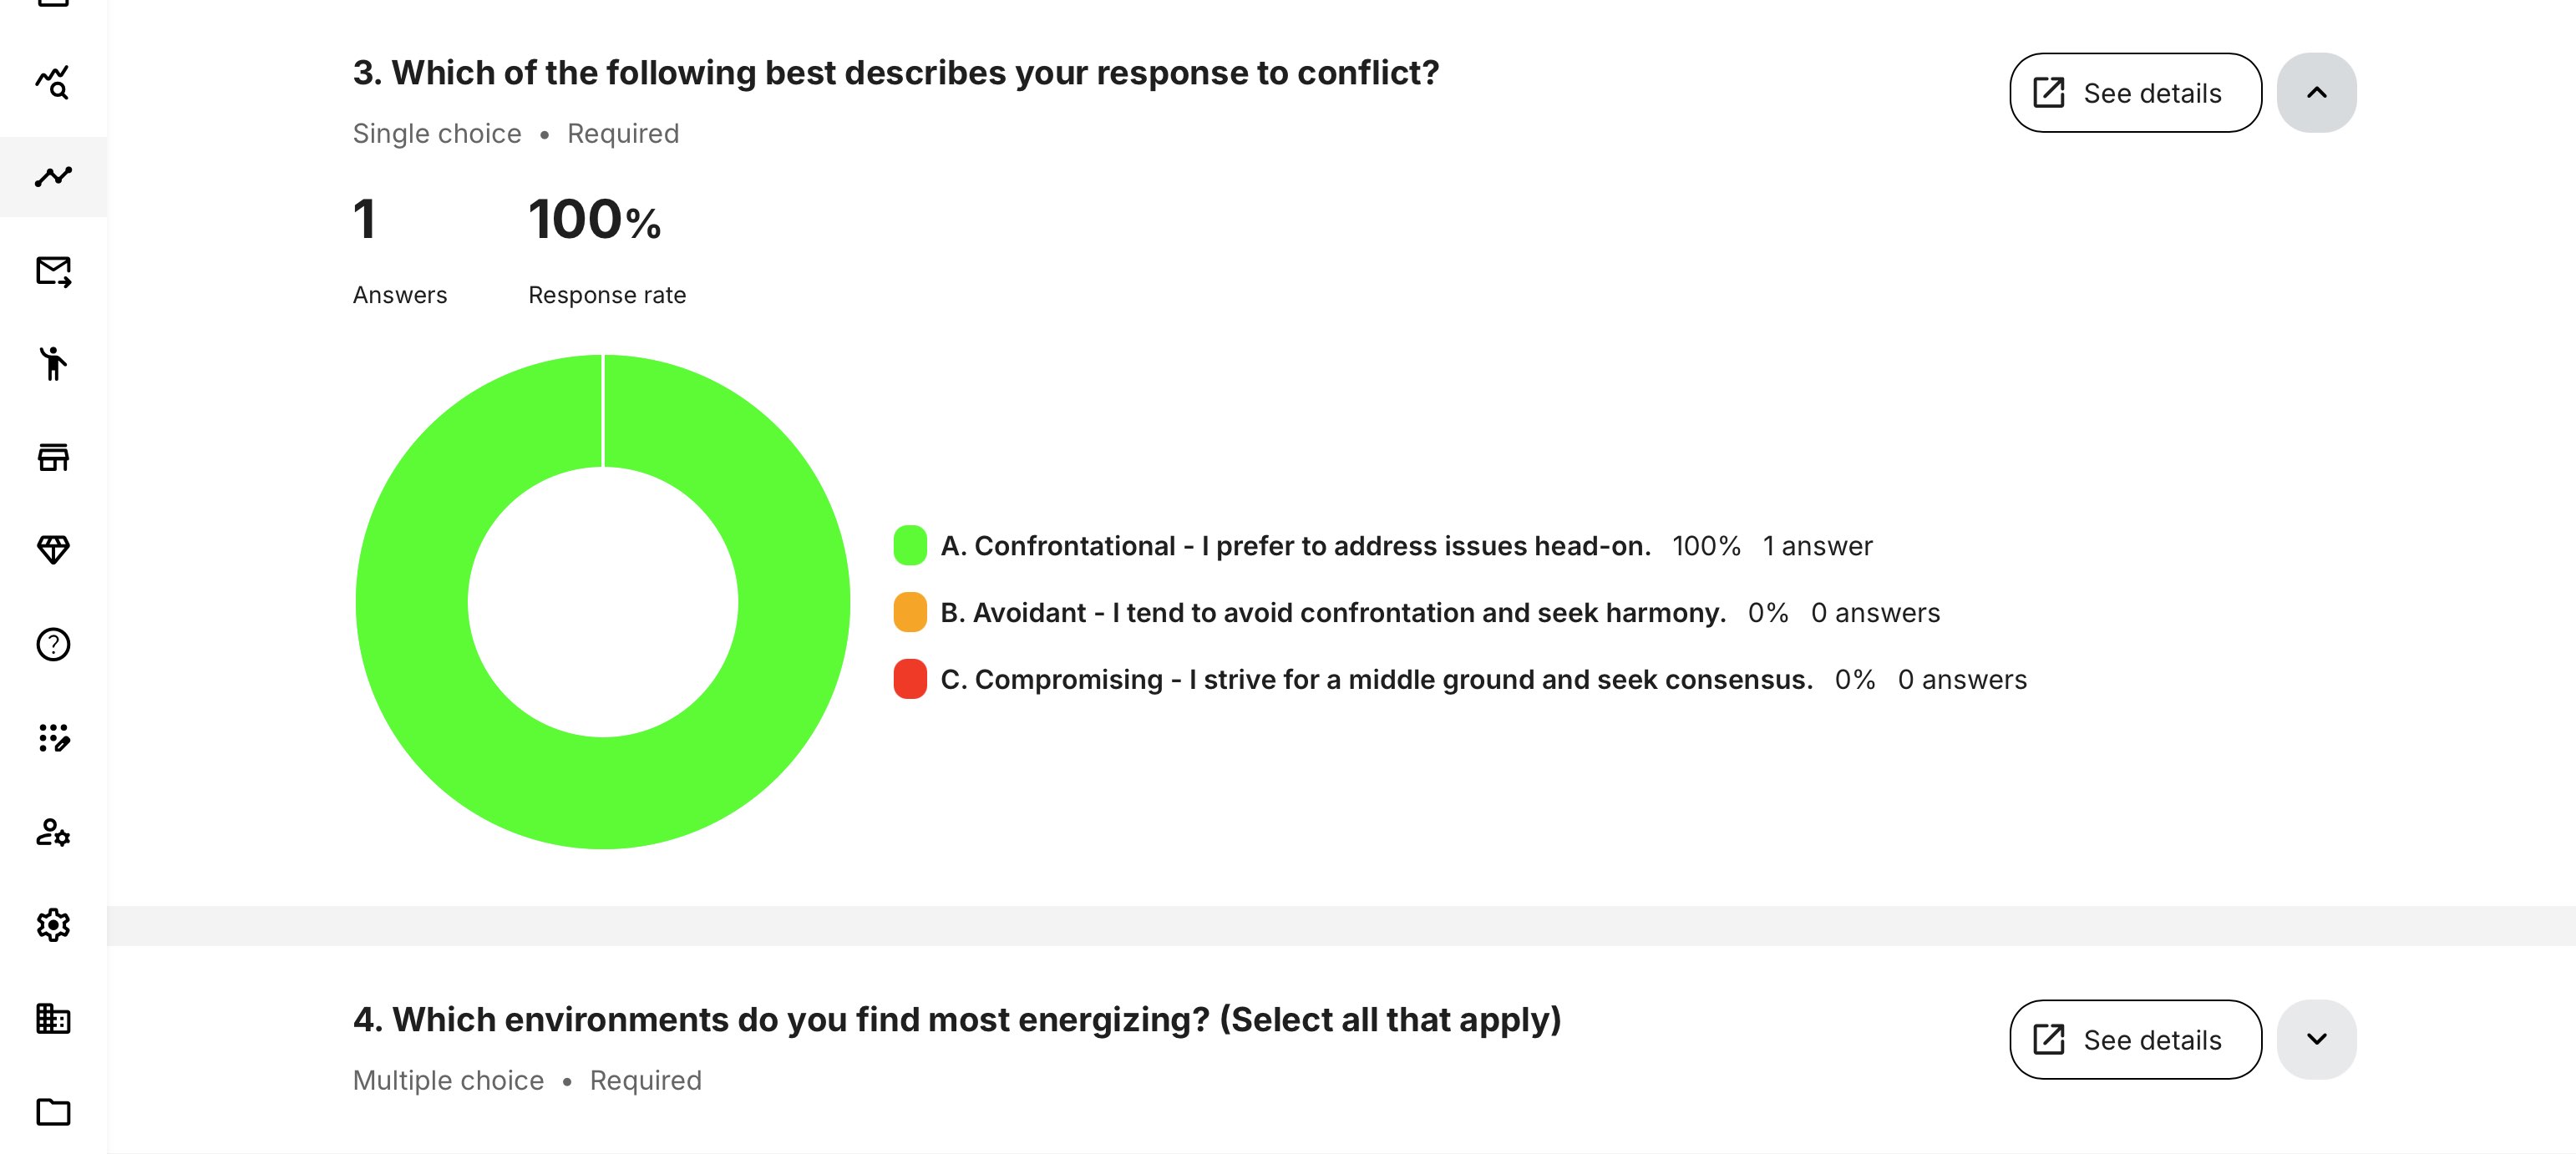
| Visual Charts | Visual representation of answers (where supported) | Only available for question types that support aggregation |
| Pie Charts | Used for single-selection questions | Single Choice, Dropdown, Rating Scale |
| Horizontal Bar Charts | Used for multi-selection or scale-based questions | Multiple Choice, Linear Scale, Consent |
| Large Option Sets | Questions with many answer options | If a question has more than 15 options, results are shown in a paginated table instead of a chart |
| See Details View | Drill-down to individual responses | Displays usernames, avatars, and timestamps; available only for chart-supported question types |
Respondent Visibility and [See Details] Behavior
On questionnaires, respondent-level visibility in analytics is controlled by a dedicated privacy setting in the questionnaire configuration.
- Selecting [See details] opens a respondent-level view showing individual replies with names, avatars, and timestamps only if respondent visibility is enabled
- If “Show respondents’ names and emails in analytics and report” is not enabled, the [See details] option is hidden and analytics remain aggregated. In this case, a message is displayed indicating that participant data is restricted by the questionnaire’s settings.
This behavior applies consistently across all roles and ensures that privacy and data protection decisions made at questionnaire level are respected in both analytics and reports. The option is available only for question types that support chart-based analytics.
What Happens When a Questionnaire Is Revised
Questionnaires in Eurekos are versioned. When a questionnaire is edited in a way that affects its structure or logic, a new revision is created, while cosmetic or instructional changes typically do not. This ensures historical answers remain valid and analytics stay accurate over time.
| If you change… | Then… |
|---|---|
| Question structure, options, logic, or answer format | A new revision is created |
| The questionnaire revision | Question-level charts restart for the new version |
| Overall participation | Total responses remain cumulative |
| Historical answers | Preserved and unchanged |
| Reports | Still include all historical answers, tied to their revision |
Key Clarification: What About Previous Answers?
Nothing is lost.
Answers submitted under earlier revisions are fully retained for reporting, audits, and compliance.
- They do not appear in current question-level charts, because the questions may no longer match
- They remain available in reports, with correct timestamps and context
- This prevents mixing answers from different question structures, which would otherwise distort analytics
In short:
- Analytics show what’s true now
- Reports preserve what happened then
Questionnaires Report
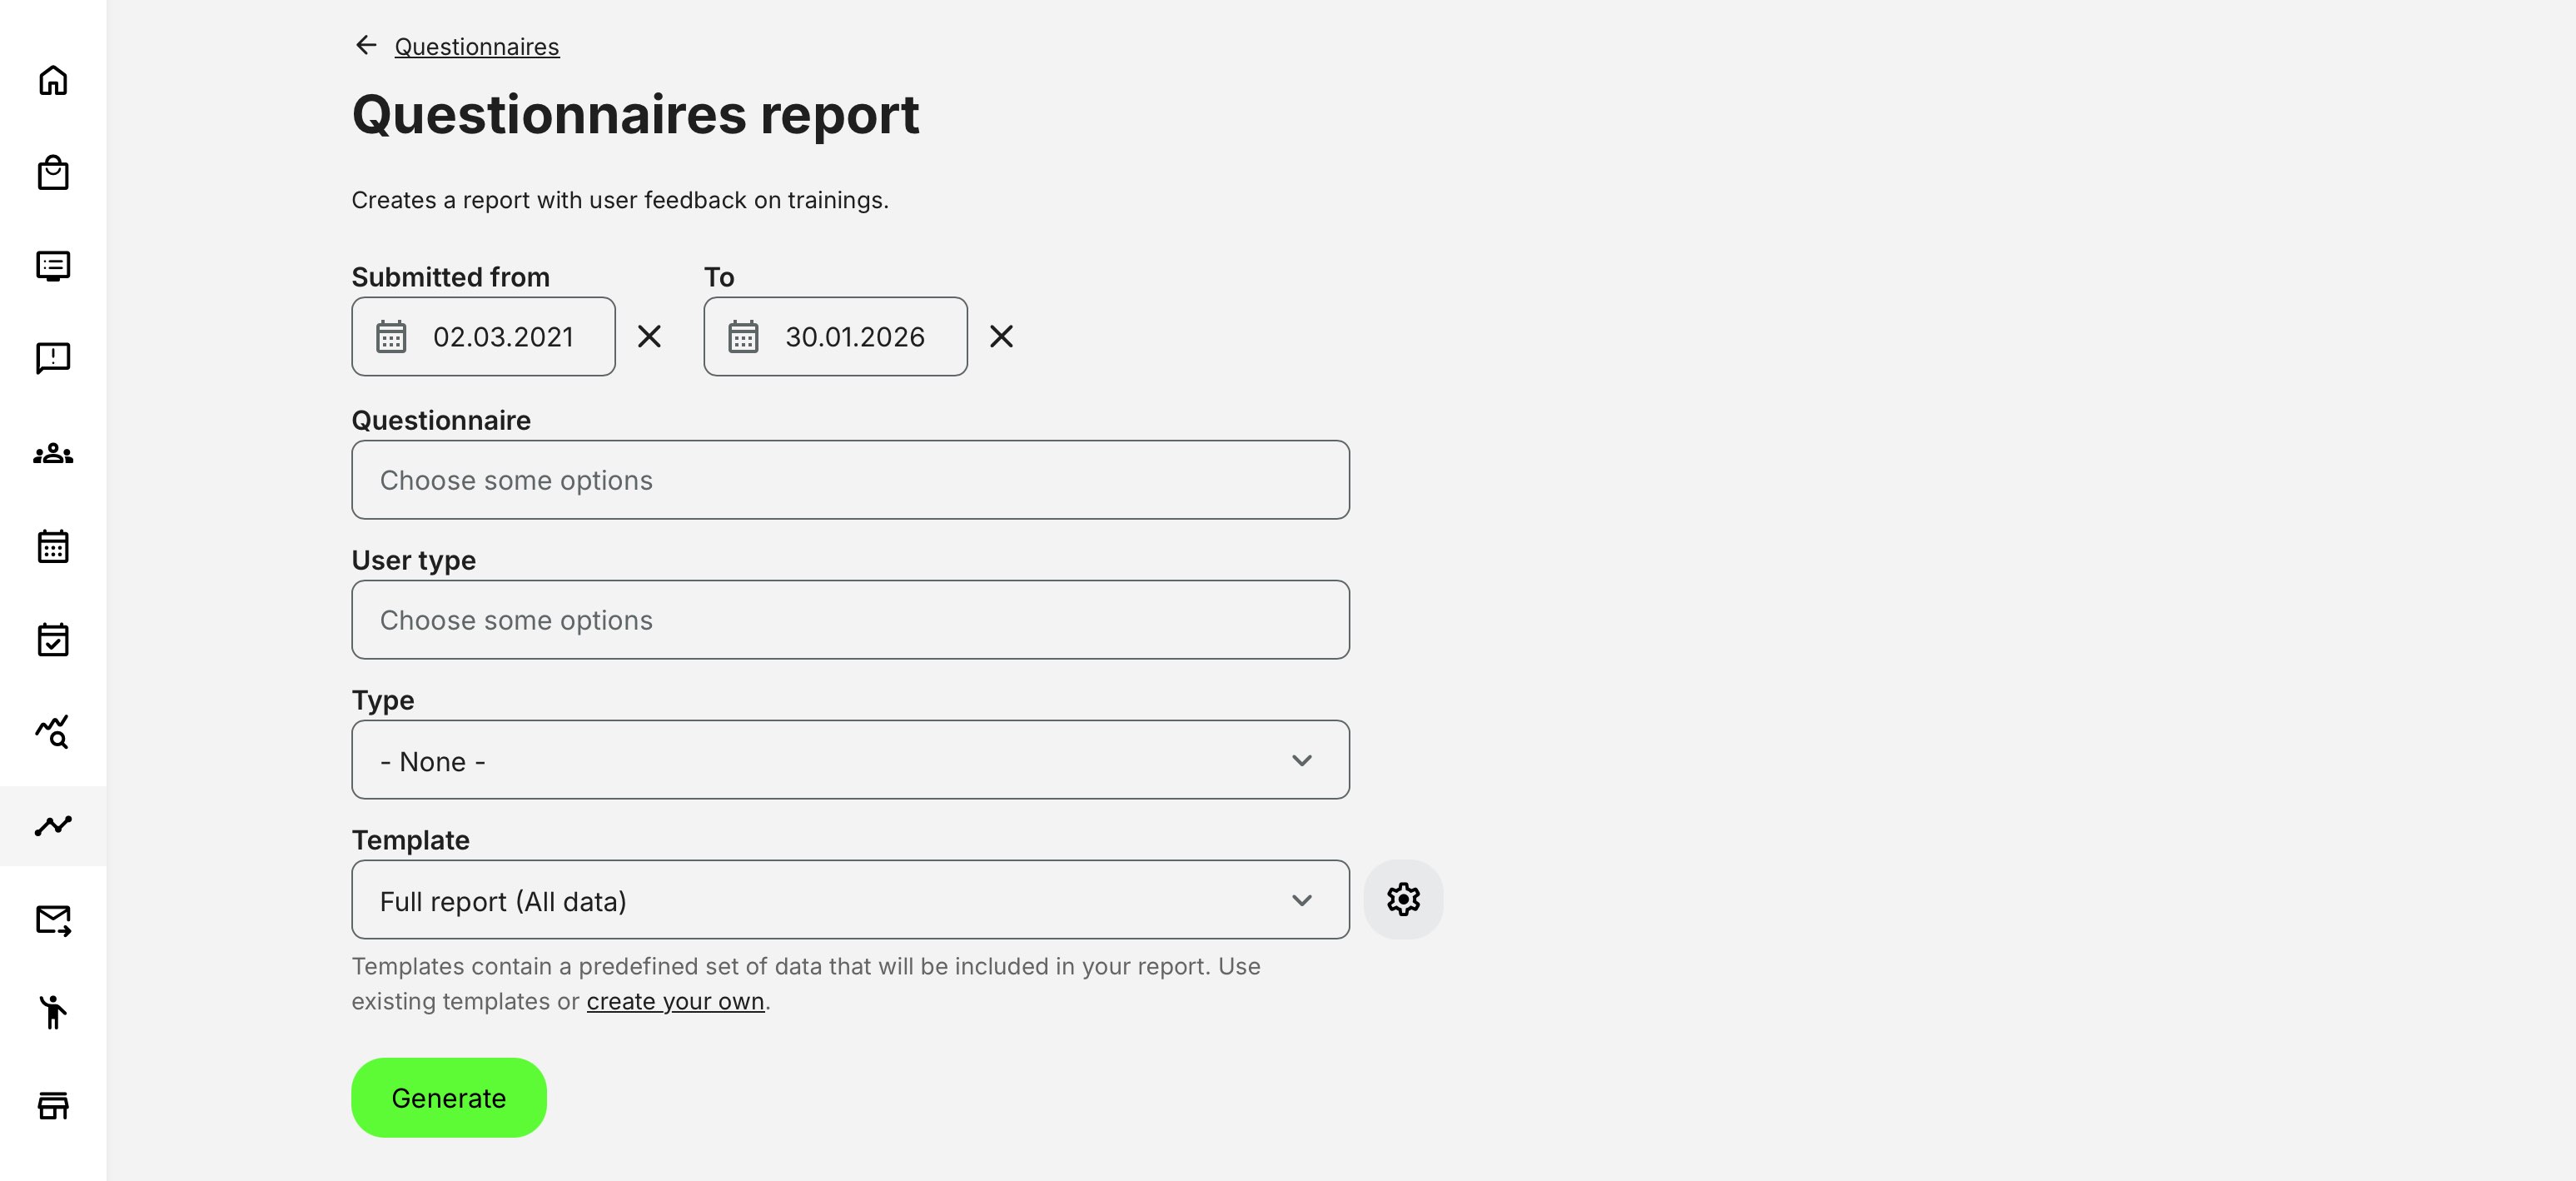
The Questionnaires Report form is designed to give administrators precise control over which responses are included in the exported file and how detailed the output should be. Each selection in the form directly impacts the structure, scope, and granularity of the resulting report.
Rather than being tied to a single activity or questionnaire instance, this report operates across the platform—allowing responses to be analyzed across programs, regions, audiences, and time periods in one consolidated output. Reports are accessed via [Get report], ensuring a consistent and audit-ready output whenever structured evidence is required.
How Questionnaire Report Filters Work Together
The Questionnaires Report form is context-aware. Rather than exposing every possible filter at all times, the system dynamically adjusts available options based on how questionnaires are actually used on the platform.
This means the form is not a flat list of independent filters—it reflects real usage relationships between questionnaires, activities, roles, and delivery contexts. As a result:
- Some filter options only appear after another selection is made
- Some options disappear if they are not relevant to the selected questionnaire
- The report always reflects actual data paths, avoiding empty or misleading exports
At a high level, report configuration is driven by four core decisions:
- When the response was submitted (date range)
- Which questionnaire or activity context the response belongs to
- Who submitted the response (learner or instructor)
- How the data should be structured (template and column selection)
Simplified Filter Dependency Model
| Configuration Area | What You Select | What It Controls | Dependency Behavior |
|---|---|---|---|
| Date range | From / To dates | Time window for included submissions | Always available. Defines the temporal scope of the report |
| Questionnaire | One or more questionnaires | Primary filter for responses | Limits all downstream options (Type, Subtype) to contexts where the selected questionnaire was actually used |
| Type (usage context) | Activity, Enrollment, Button, URL, Rule, etc. | Where the questionnaire was presented | Only shows types that are valid for the selected questionnaire. If the questionnaire was never used in a given context, that type is not available |
| Subtype (entity) | Specific activity, course, rule, workflow | Exact instance where questionnaire appeared | Available only after Type is selected. List is permission- and organization-aware |
| User type | Learner or Instructor | Who submitted the response | Filters responses based on role-specific questionnaire usage (e.g. instructor-only feedback configured in course administration) |
| Anonymous responses | Include / exclude | Whether anonymous submissions are returned | Only available for URL-based questionnaires or contexts that support anonymous feedback |
| Template | Simple, Full, or custom | Which columns are included | Determines report structure, not filtering. Applies after all other selections |
A critical point for administrators to understand is that the report form does not show what could be done — it shows what has been configured and used.
For example:
- If a questionnaire was only used as learner feedback inside activities, instructor responses will never appear as an option
- If a questionnaire was never embedded in a Button widget, that type will not be selectable
- If a questionnaire was never published via URL, anonymous filtering will not be available
- If a user does not have access to a given organization, activity, or rule, it will not appear in subtype selections
This design prevents accidental misconfiguration and ensures that every generated report contains real, meaningful data.
Questionnaire Report – Type Selection Overview
The Type selection defines where and how a questionnaire was used on the platform. This filter is context-driven and dynamically adapts based on the selected questionnaire. Only usage contexts where the questionnaire has actually been deployed are available, ensuring that reports always return valid and meaningful data.
Once a Type is selected, the report can be further narrowed to specific entities (subtypes), such as individual activities, courses, rules, or workflows—subject to user permissions and organizational scope.
| Type | What It Represents | Subtype Behavior |
|---|---|---|
| Activity | Questionnaire embedded directly in an activity (course, class, or event) | Allows selection of specific activities where the questionnaire was used |
| Button widget | Questionnaire launched via a button on a course page | Allows selection of specific courses containing the button |
| Enrollment request | Questionnaire presented as part of the enrollment request flow | Allows selection of activities using this enrollment configuration |
| Enrollment request confirmation | Questionnaire shown after enrollment approval | Allows selection of activities with confirmation questionnaires |
| On-demand | Questionnaire presented during on-demand activity access | Allows selection of relevant on-demand activities |
| Onboarding rule | Questionnaire used within an onboarding or automation rule | Allows selection of specific rules |
| Automated email workflow | Questionnaire accessed through a link in an automated email | Allows selection of specific email workflows |
| Supplemental questionnaire | Profile-based questionnaire tied to user records | No activity subtype; responses update a single evolving record |
| URL | Questionnaire accessed via a direct link | Enables option to include anonymous responses |
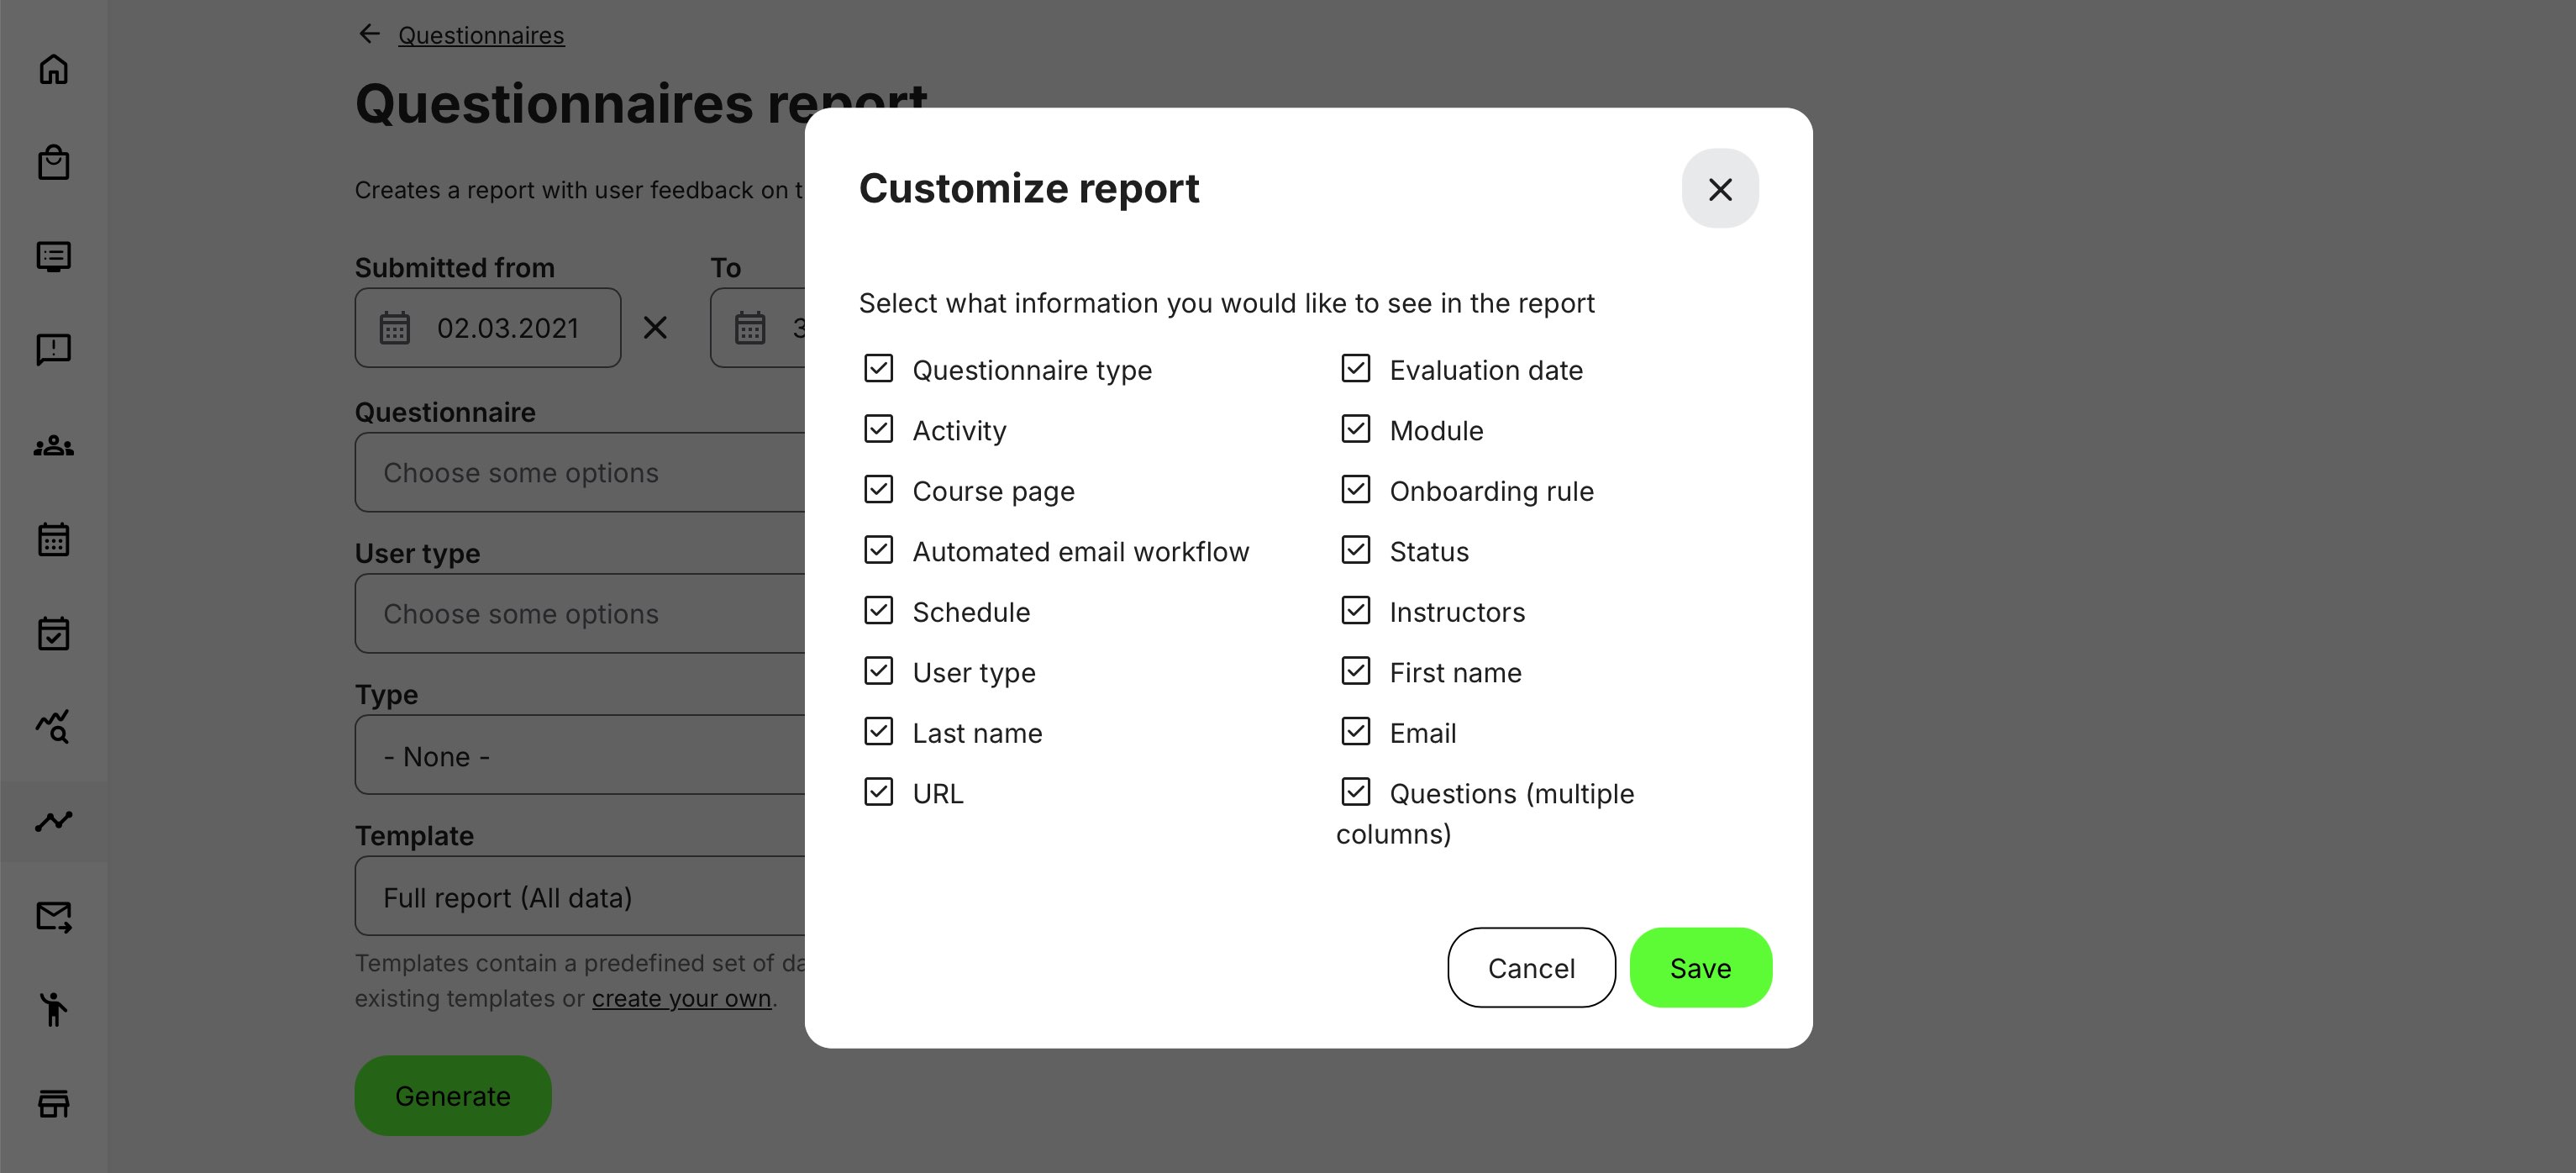
Questionnaires Report – Data Fields
The Questionnaires Report is exported as a structured, row-based file designed for detailed inspection, auditing, and downstream analysis. Each record represents a single response to a specific question, enriched with contextual information about the respondent, the questionnaire, and the usage context in which it was presented.
The file structure adapts dynamically based on selected filters, questionnaire usage types, and configuration options such as anonymity and external identifiers—ensuring the exported data is both comprehensive and aligned with governance and access rules.
| Field / Column | Description |
|---|---|
| Questionnaire title | The name of the questionnaire the response belongs to |
| Questionnaire version | The version of the questionnaire at the time the response was submitted (where versioning applies) |
| Usage type | Context in which the questionnaire was used (e.g. Activity, Enrollment request, URL, Email workflow, Onboarding rule) |
| Entity title | The name of the activity, course, rule, or workflow where the questionnaire was presented |
| Entity ID | Internal identifier of the activity, course, rule, or workflow |
| User full name | Name of the respondent (shown as Anonymous where applicable) |
| Respondent email address (blank for anonymous responses) | |
| User ID | Internal platform user identifier (if available) |
| External ID | External identifier (HR, CRM, or other system reference), if configured |
| User type | Indicates whether the response was submitted by a Learner or an Instructor |
| Organization | Organizational unit or sub-organization, where applicable |
| Tags / Country | User country and profile tags at time of submission |
| Evaluation date | Date and time the questionnaire was submitted (timezone-aware) |
| Question text | The full text of the question as presented to the user |
| Question type | Type of question (e.g. Multiple choice, Rating scale, Free text, Consent) |
| Answer value | The recorded answer (text, selected option, numeric value, Yes/No, etc.) |
| Answer label | Human-readable option label (for choice-based questions) |
| Score / Value | Numeric value where applicable (ratings, scales, scored questions) |
| Language | Language in which the question and answer were displayed |
| Anonymous flag | Indicates whether the response was submitted anonymously (requires active configuration) |
| Worksheet separation | If multiple questionnaires are selected, each questionnaire is exported as a separate worksheet |
Important Structural Notes
- The report is row-based, with one row per question per respondent
- Selecting multiple questionnaires results in one worksheet per questionnaire
- Column availability adapts dynamically based on:
- Question type
- Usage type
- Platform configuration (e.g. anonymity, external IDs)
- Question texts, answer labels, and values are exported in the respondent’s language
- Timestamps reflect the user’s configured timezone, ensuring audit accuracy
Permissions, Data Access, and Organization Layer
Questionnaires Analytics and Report is governed by role-based permissions and the organization layer. Users can only see data they are authorized to access based on their role, organizational affiliation, and scope of responsibility.
In practice:
- Data visibility is limited to permitted organizations, activities, and entities
- Parent organizations can see aggregated sub-organization data; sub-organizations cannot see upward or sideways
- Blocked users remain visible for historical accuracy; deleted users are excluded for privacy compliance; Cancelled and expired enrollments remain visible for audit and traceability
- The same rules apply consistently to both on-screen analytics and exported reports
This ensures secure, consistent, and audit-ready access to data across the platform.
Deviation:
- Instructor visibility is limited strictly to questionnaires tied to activities they are responsible for
- Anonymous responses may appear depending on questionnaire type and configuration
Questionnaire Question Types – Analytics Behavior Overview
This table helps quickly understand what insights are realistic to expect from each question type—and which follow-up actions (design, wording, placement, or policy review) make sense based on the data.
| Question Type | What It Captures | How It Appears in Analytics | What to Look For |
|---|---|---|---|
| Single Choice | One selected option | Response distribution per option, response rate | Clear preference patterns, dominant answers, polarization |
| Multiple Choice | One or more selected options | Percentage per option, total selections may exceed participants | Overlapping preferences, unclear wording, option overload |
| True / False | Binary decision | Split distribution (true vs. false) | Misunderstanding of concepts, overly simplistic framing |
| Rating (Scale / Likert) | Sentiment or satisfaction level | Average score, distribution across scale | Trend shifts over time, satisfaction gaps between cohorts |
| Text / Open Answer | Qualitative feedback | Free-text responses (report-only), no aggregation | Recurring themes, sentiment clues, follow-up opportunities |
| Yes / No (Consent) | Explicit acknowledgment | Accepted vs. not accepted counts | Compliance coverage, missing acknowledgements |
| Checkbox (Consent) | One or more confirmations | Accepted / not accepted per item | Partial consent patterns, policy clarity issues |
| Dropdown | Single selected value from list | Distribution per option | Regional or role-based variation |
| Date / Time | Declared date or timestamp | Raw values (report), not visualized | Validity windows, timing anomalies |
| Numeric Input | Entered number | Raw values, optional aggregation in reports | Outliers, data quality issues |
| File Upload | Submitted document | Presence / absence indicator | Completion compliance, missing documentation |
| Button / Action Trigger | Acknowledgement via action | Recorded interaction event | Confirmation that users reached a required step |
Understand the context
- Analytics views are strongest for choice-based, rating, and consent questions
- Reports are essential for text responses, numeric input, dates, and file uploads
- High response rate + skewed distribution often indicates clarity
- Low response rate or wide dispersion often signals confusion, fatigue, or poor placement
- Consent questions should always be monitored for coverage, not sentiment
When to Use Analytics vs Reports
Use Analytics when you need:
- Live insight into response rates and patterns
- Visual breakdowns per question
- Immediate situational awareness
Use Reports when you need:
- Exportable, respondent-level data
- Audit documentation
- Cross-system analysis
- Long-term record keeping
Used together, Questionnaires Analytics and Reports transform feedback and assessment data into actionable insight and defensible evidence—across the entire platform.
Real-World Use Case: Instructor Performance and Regional Quality Oversight
A global training organization delivers instructor-led programs across multiple regions, with different instructors responsible for delivery in each geography. After every session, participants complete standardized questionnaires covering course quality, instructor effectiveness, and learning relevance.
Regional training managers and central administrators regularly pull the Questionnaires Report to review feedback across all instructors and regions within a defined period. Because the report aggregates responses across activities and programs—rather than being tied to a single course—it enables a holistic view of instructional quality and learner experience.
Instructors themselves may also access the report, but only see responses related to the activities they are responsible for. This ensures that instructors can review feedback, reflect on outcomes, and improve their delivery—without gaining visibility into data from other instructors, regions, or programs. The same report mechanism therefore supports both self-improvement and organizational oversight, while maintaining strict data governance.
The analytics include responses from blocked users, ensuring historical feedback remains available even if a participant later changes status. Responses from deleted users are excluded to support privacy compliance, while cancelled and expired signups are still reflected—allowing managers to correlate feedback with attendance volatility, scheduling challenges, or delivery conditions.
Using filters by questionnaire, activity type, instructor role, and region, administrators and managers can:
- Compare instructional quality across regions using consistent evaluation criteria
- Identify delivery formats or locations that consistently perform better or worse
- Detect early warning signs of instructional or logistical issues
- Support instructor coaching and regional quality initiatives with evidence-based insight
For governance and audit purposes, exported reports provide a verifiable record of feedback collection, scope, and timing—demonstrating that instructor evaluation is systematic, role-aware, and compliant across the organization.