Content Engagement Analytics - Article
Summary
Content Engagement analytics reveals how learners interact with individual learning objects across activities. It helps administrators understand usage, drop-offs, revisits, and format performance so learning design decisions can be based on evidence rather than assumptions.
In this article you will learn:
- How Content Engagement analytics shows interaction with pages, videos, and learning objects
- How to identify usage patterns, drop-offs, and repeated content interaction
- How engagement data supports evidence-based learning design decisions
- How this analytics view complements progress, certification, and adaptive learning reports
Overview
Content Engagement Analytics in Eurekos provides granular insight into how learners interact with individual learning objects inside activities—such as pages, videos, H5P interactions, SCORM modules, audio, presentations, and more. Rather than focusing only on completion or attendance, this analytics area reveals how content is consumed, revisited, skipped, or struggled with.
This level of insight is particularly valuable because Eurekos combines native authoring and detailed progress tracking into a single analytical model. The result is a meta-level view that allows course designers, instructional designers, and administrators to evaluate learning effectiveness at the level where learning actually happens: the content itself.
Content Engagement Analytics becomes most powerful when viewed in relation to other analytics rather than as a standalone dataset. On its own, engagement data shows how learners interact with pages, videos, and learning objects—but when combined with progress, certification, and adaptive learning reports, it reveals why outcomes occur.
For example, if learners in a certification track consistently spend excessive time on a specific video or repeatedly revisit the same page, and certification analytics show longer time-to-certification or higher drop-off at that point, this correlation signals a potential design issue. The content may be too dense, unclear, or misaligned with learner expectations.
In an adaptive learning scenario, engagement data may show that a large portion of learners are repeatedly redirected to supplemental modules triggered by an H5P assessment—while certification outcomes improve. In this case, the engagement pattern validates the adaptive strategy and confirms that the intervention is working as intended.
By correlating engagement behavior with other analytics, administrators and instructional designers can move from assumptions to evidence-based decisions. This forensic perspective makes it possible to quantify learner behavior, refine content flow, improve relevance, and continuously optimize learning journeys to drive better outcomes and higher learner satisfaction.
Content Engagement Analytics helps answer questions such as:
- Which content elements learners actively engage with—and which they skip
- Where learners spend time, return repeatedly, or drop off
- How different media types perform for different audiences
- Whether adaptive or supplemental content is used as intended
- How content engagement patterns correlate with progress, outcomes, or certification success
This transforms analytics from a compliance tool into a design and optimization tool.
Activity Structures and Drill-Down Behavior
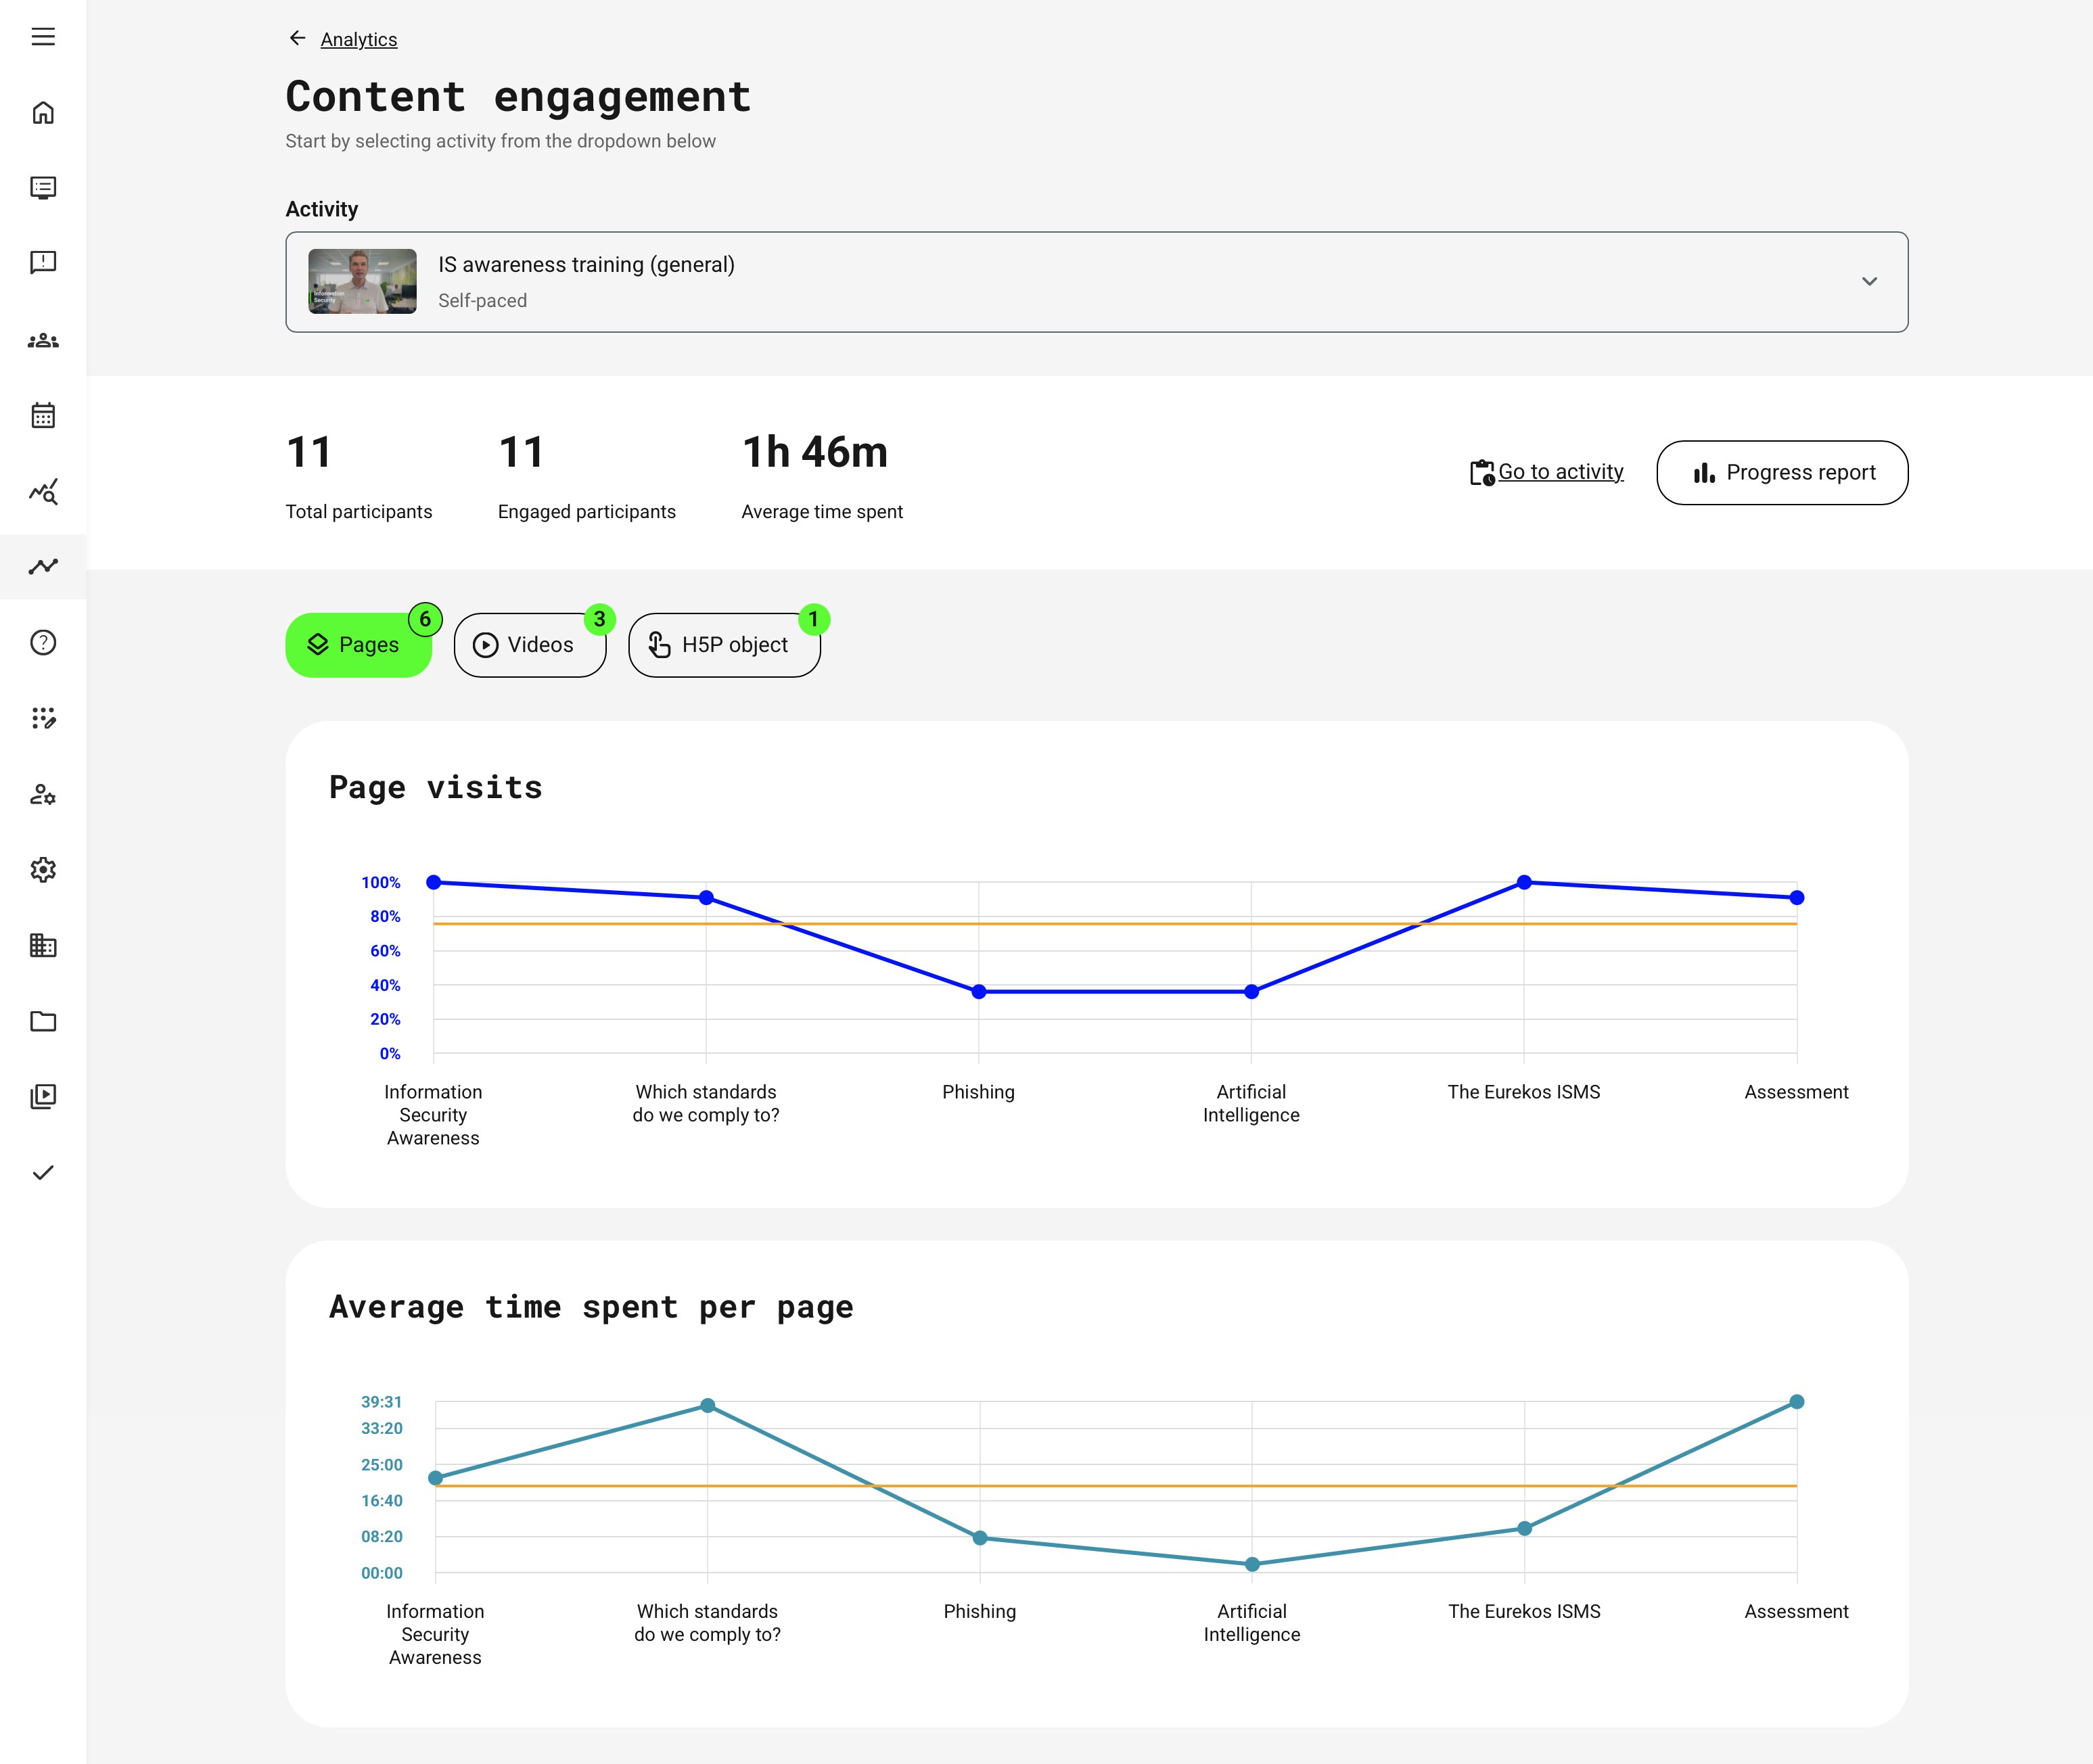
Content Engagement Analytics aggregates user interaction data across enrolled participants within a selected activity. Depending on the structure of the activity and the types of learning objects it contains, different metrics are available. At the top level, analytics provides:
- Total participants – Users enrolled in the activity
- Engaged participants – Users who interacted with at least one content object
- Quick navigation – To the activity itself and a shortcut to the Progress report for deeper operational detail (described in a separate article)
From there, analytics adapts dynamically based on activity composition. If an activity contains a single course:
- Content engagement data is shown immediately
- Engagement is grouped by content rubrics (Pages, Videos, H5P, etc.) adjusted to the content type
- Administrators can switch between rubrics to compare engagement patterns across content types within the same course
This enables side-by-side evaluation of how different formats perform for the same audience.
For activities that include multiple courses in a learning path of any type, the analytics first presents a module overview. Drill down into a specific course module to view content-level engagement. This structure mirrors the learner journey and ensures engagement data is always interpreted in the correct instructional context.
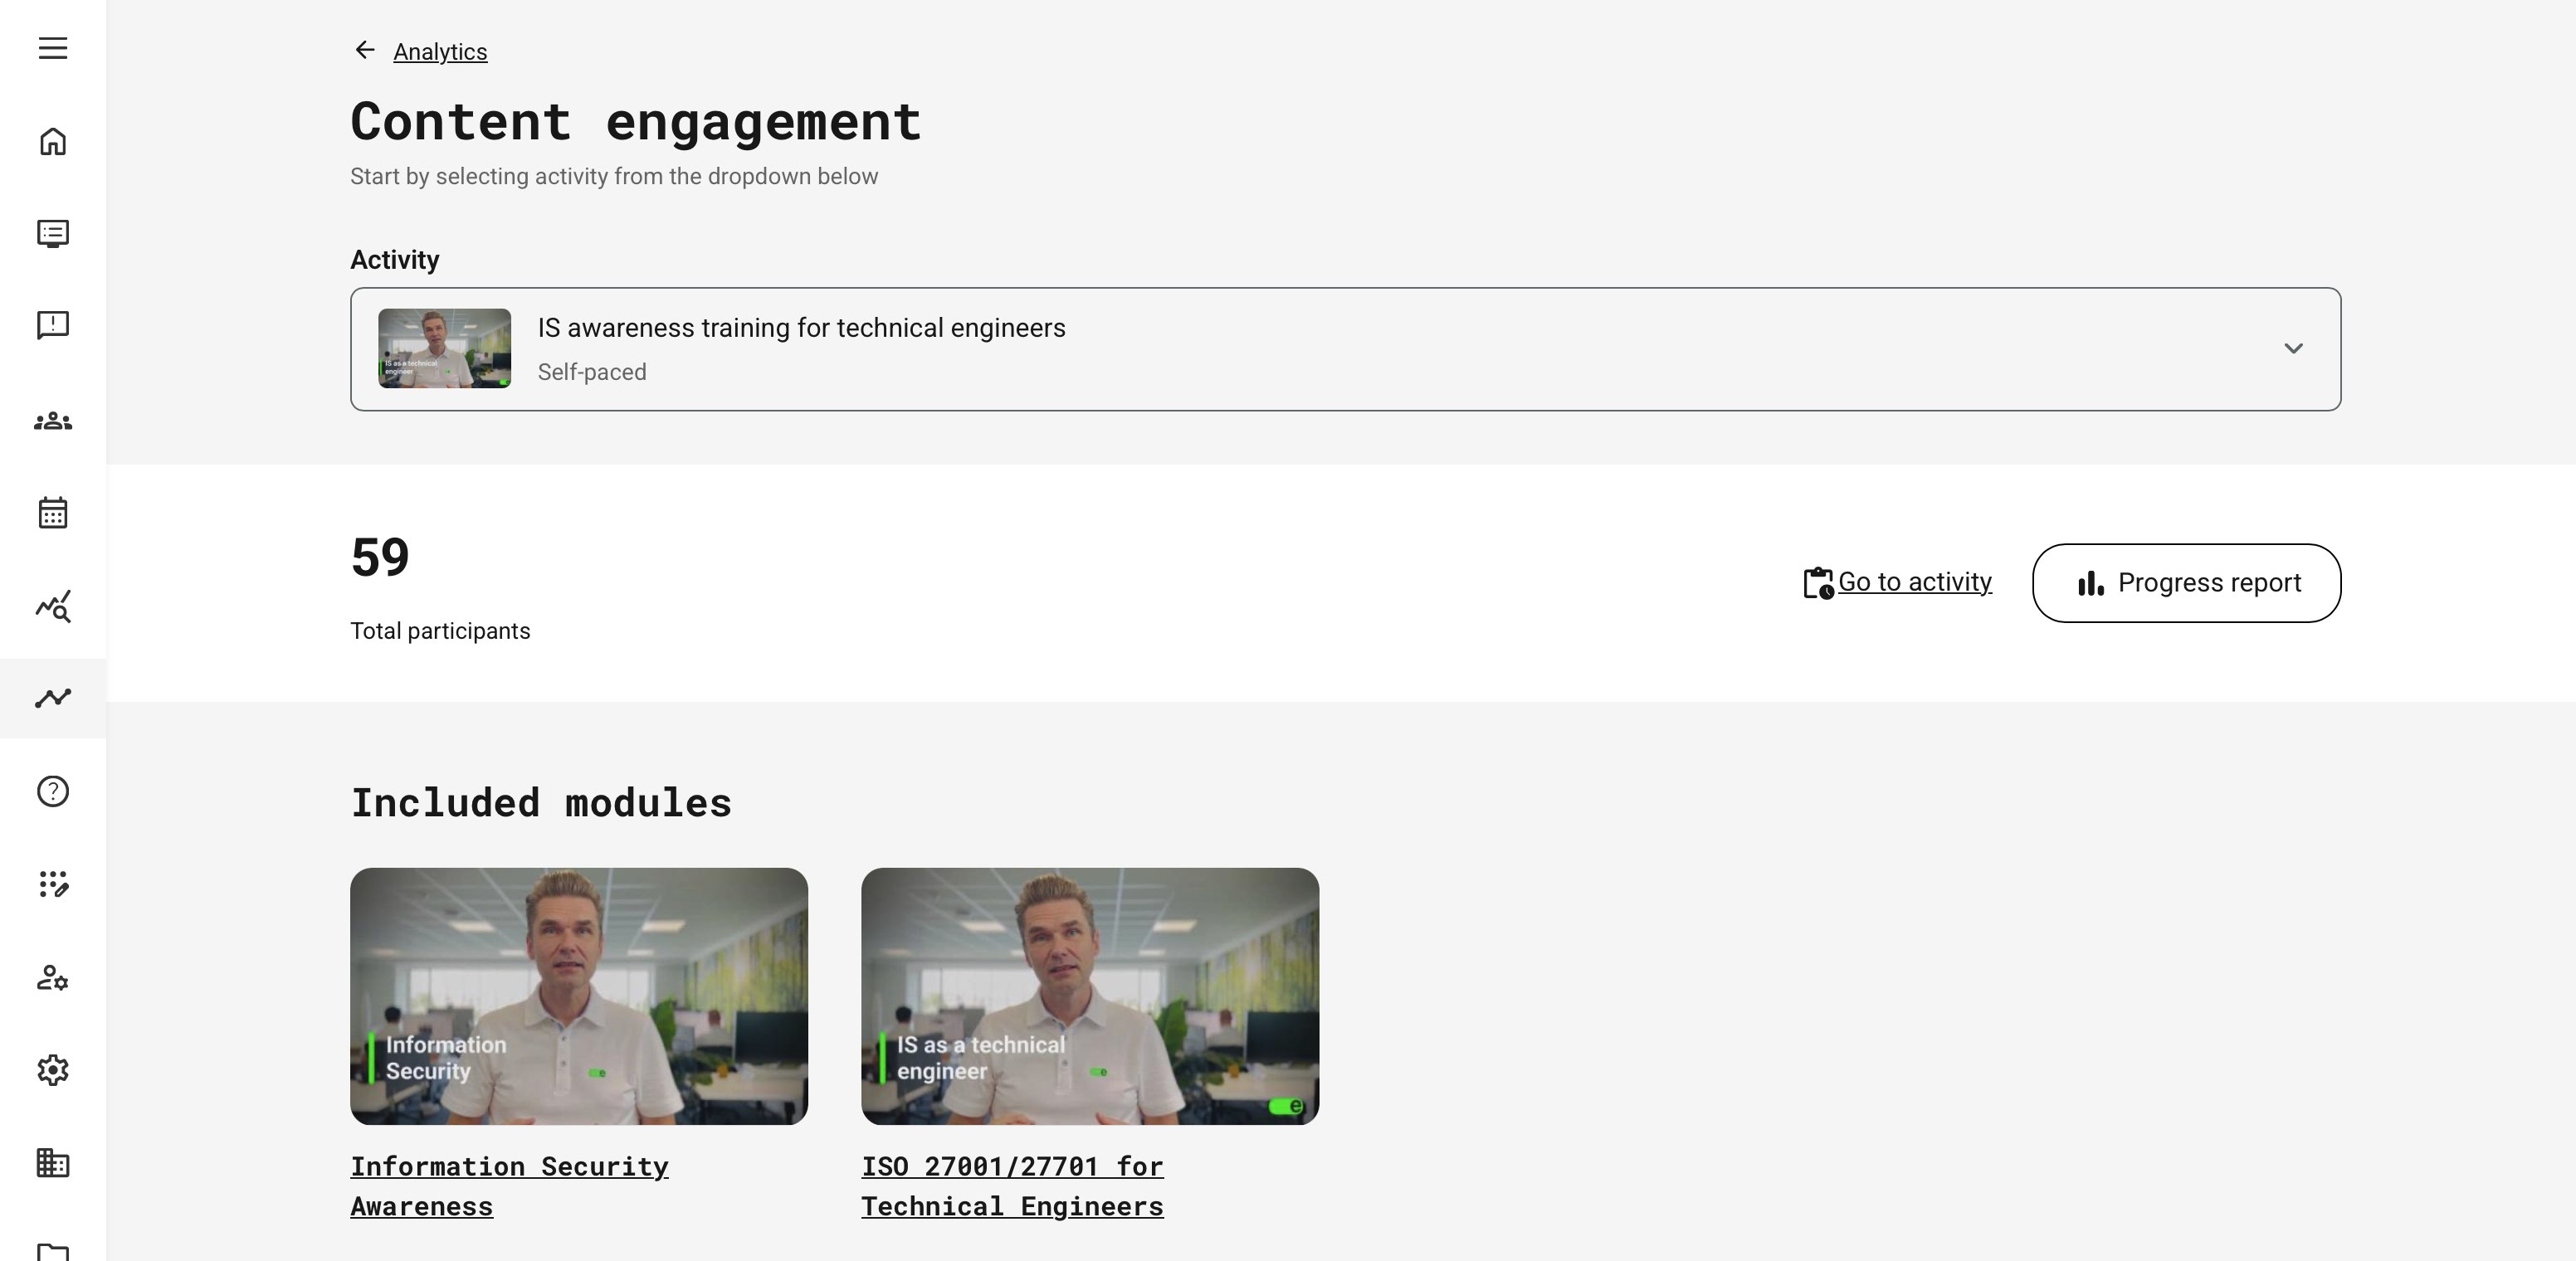
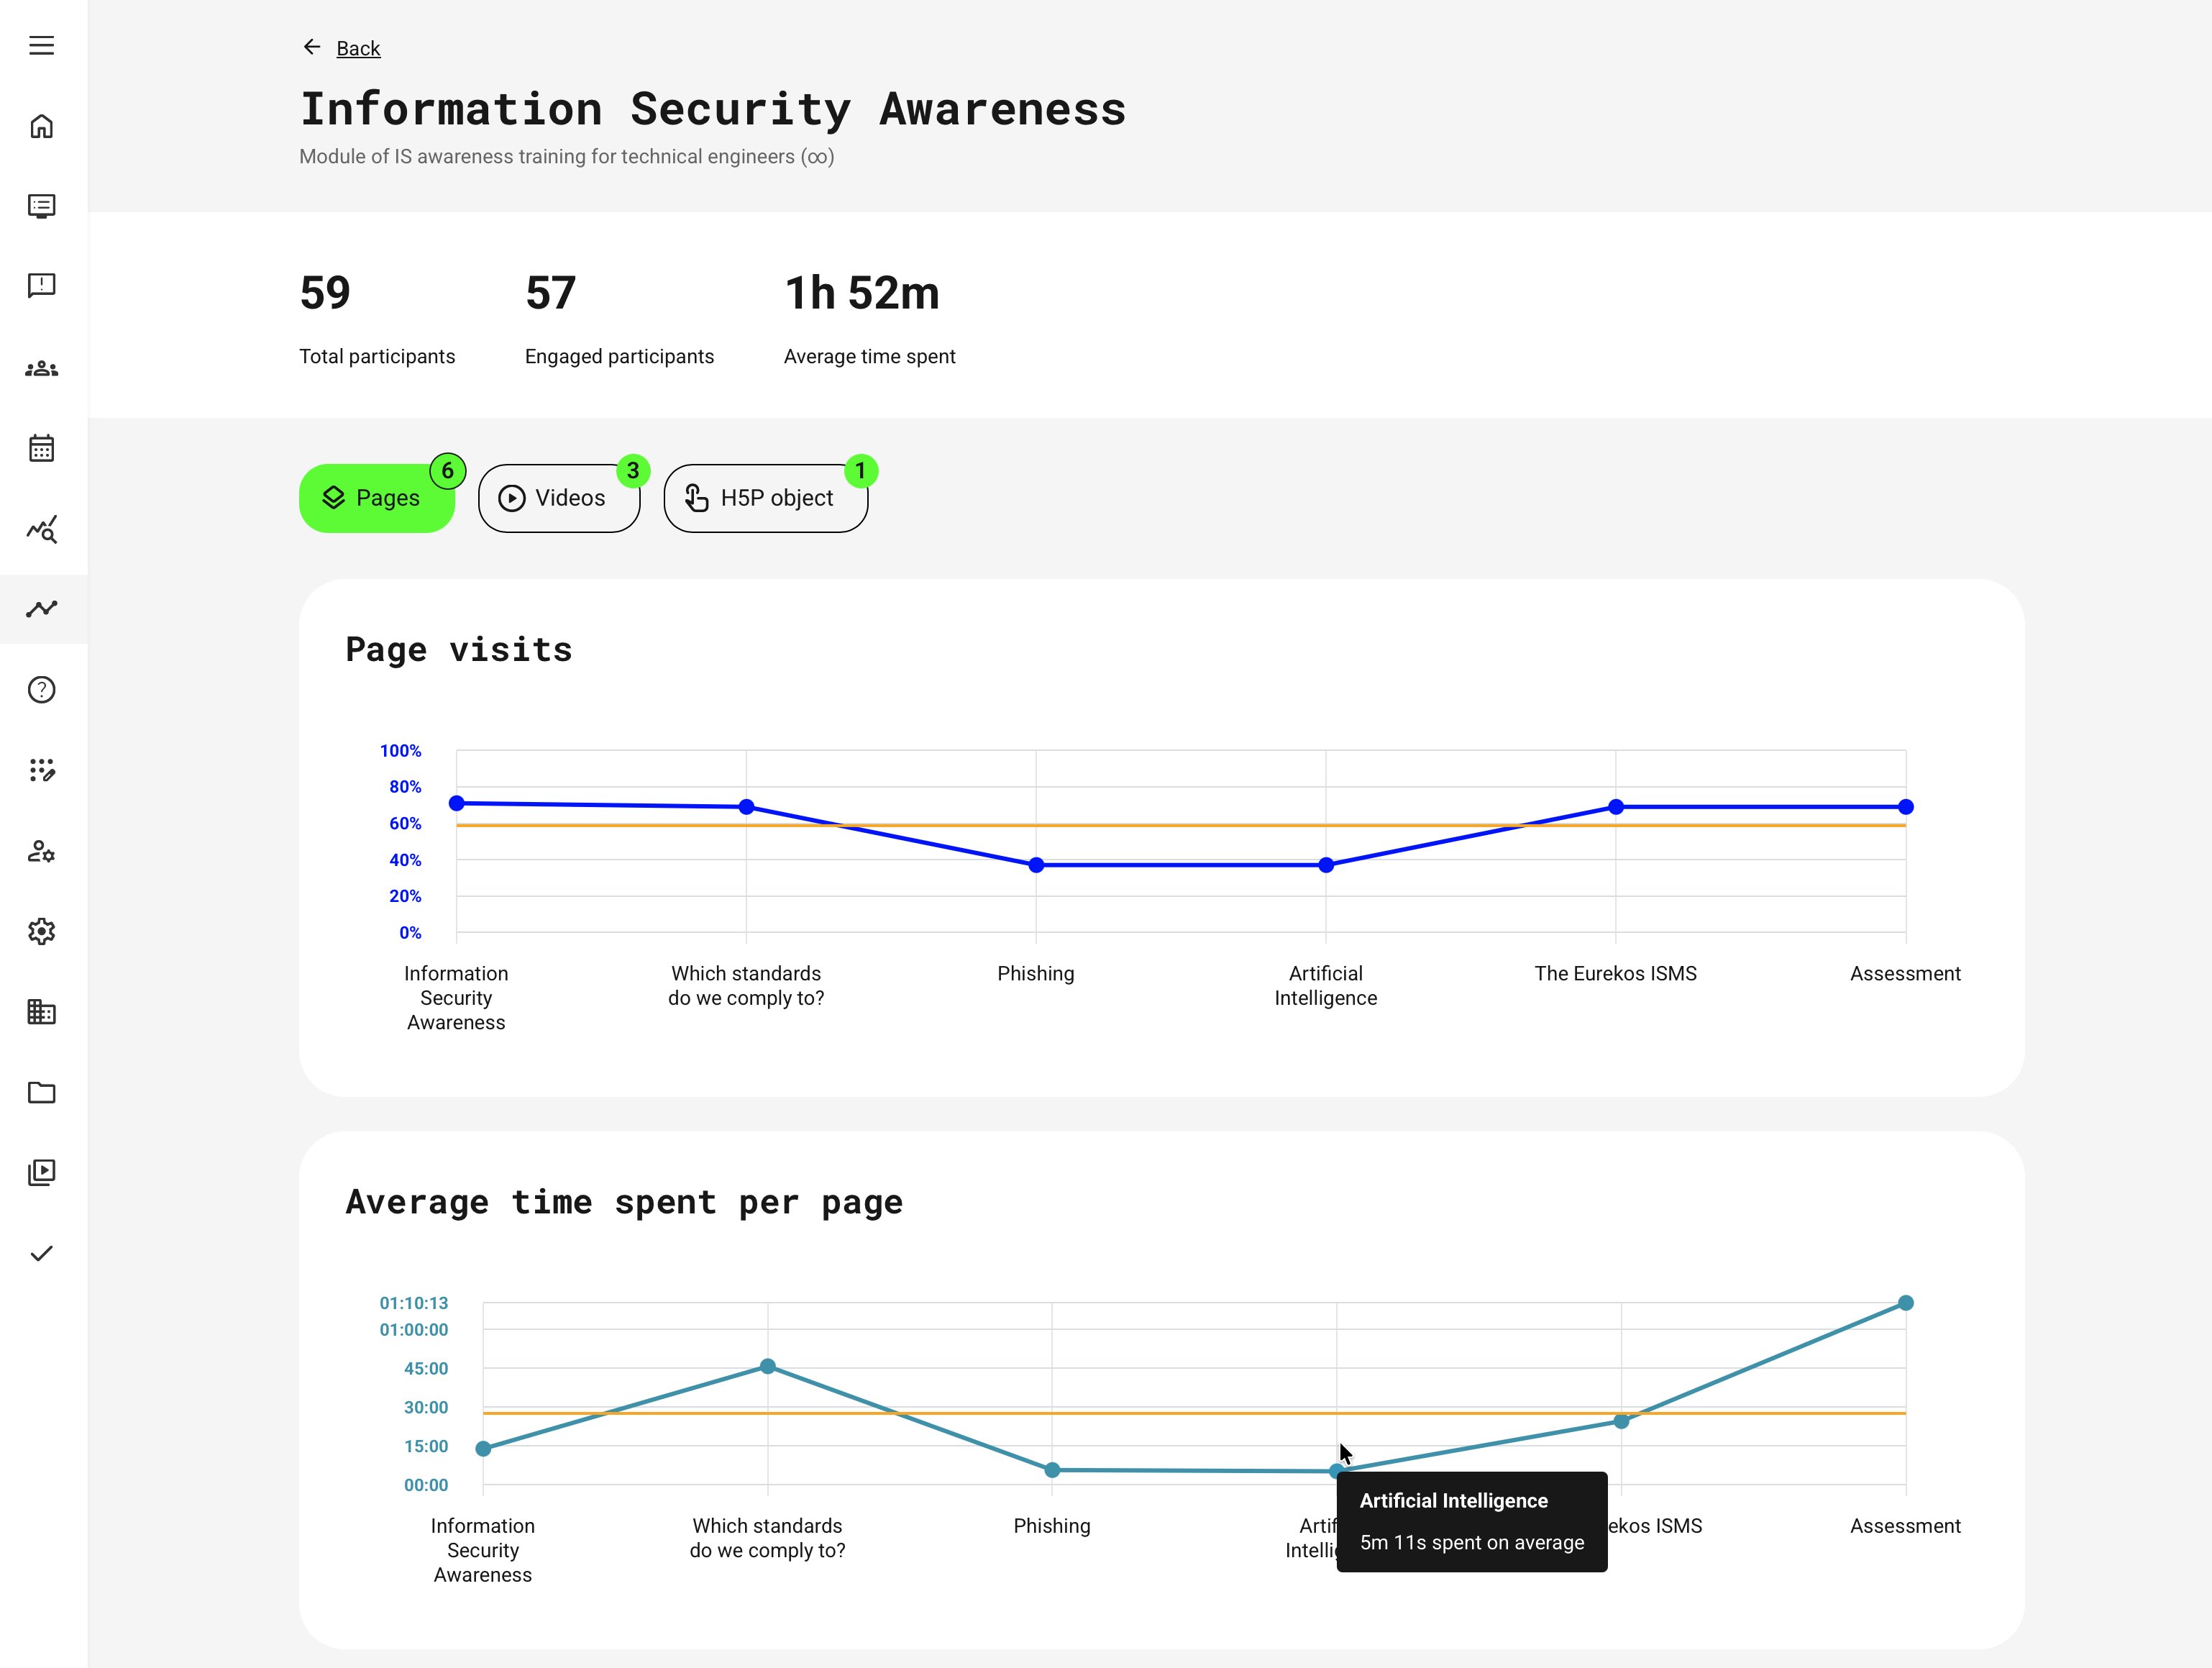
Within multi-module activities, Content Engagement Analytics focuses on each individual course module. When navigating into a module, engagement metrics are displayed exactly as they are for a single-module course, with the same measurements, behaviors, and visual structure.
Content-Specific Engagement Metrics
Each content type exposes metrics aligned with how learners interact with that medium.
| Content type | Purpose | Key engagement metrics | What this helps you understand |
|---|---|---|---|
| Pages | Evaluate reading behavior and content flow |
|
|
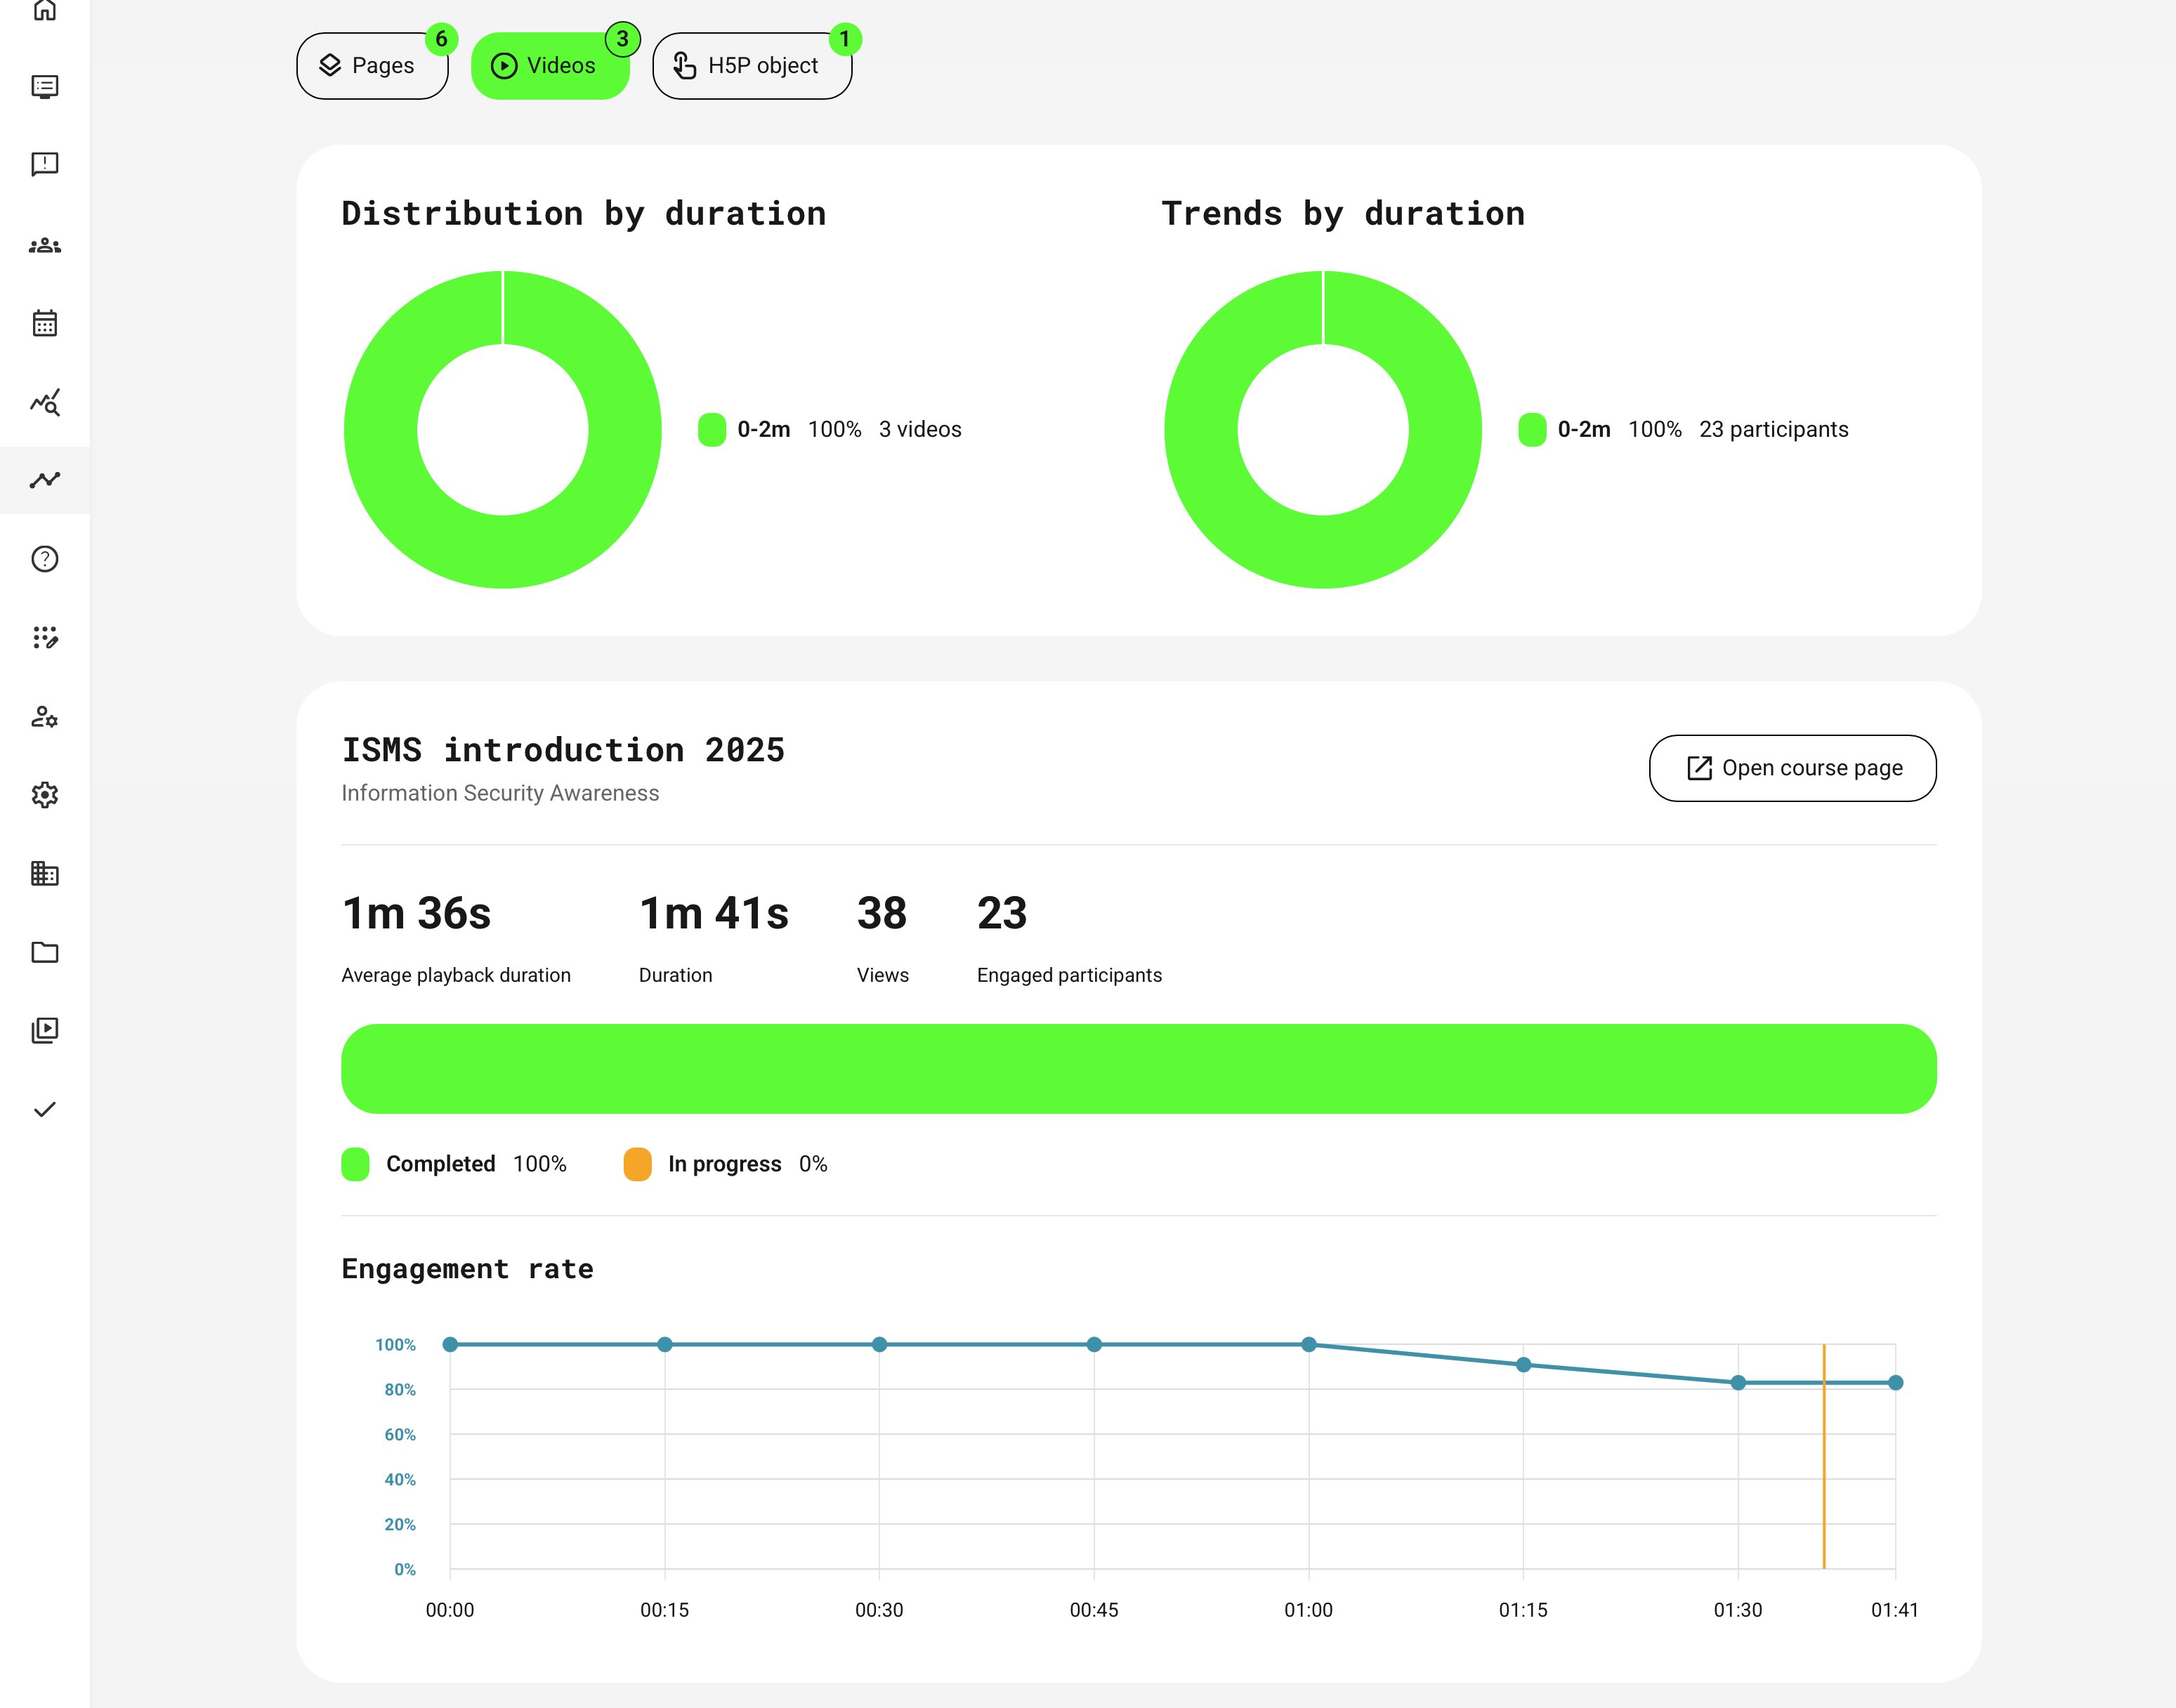
| Videos | Reveal attention, pacing, and drop-off behavior |
|
|
| H5P Objects (Interactive content) | Measure comprehension, effort, and retry behavior |
|
|
| SCORM / xAPI | Track attempt behavior and success rates for externally authored content |
|
|
| Audio, Presentations, 3D Objects | Evaluate engagement with advanced or immersive media |
|
|
Engagement in Adaptive Learning Contexts
When evaluating adaptive learning, content engagement analytics must be interpreted through the lens of design intent. Start by revisiting why adaptive modules were introduced in the first place—what learner behavior, performance gap, or assessment outcome was meant to trigger them—and what outcome you expected once they were reached.
For example, imagine an adaptive safety course where learners who fail a short scenario-based check are automatically directed to a supplemental video and interactive exercise. Engagement analytics can quickly focus on those learners actually reach the supplemental content, how much time they spend with it, and whether they complete it before progressing. If most learners skip the video or repeatedly struggle in the exercise afterward, the issue may not be the learner—it may be that the content is too long, unclear, or misaligned with the problem it is meant to resolve.
Viewed this way, analytics helps answer critical design questions:
- Is adaptive content being triggered as intended?
- Do learners meaningfully engage with it once triggered?
- Does it reduce friction and improve outcomes—or simply add complexity?
By connecting engagement data to adaptive logic, reported progress and completion reflect learning relevance, not rigid paths. The goal is to give learners what they actually need—and to use analytics as evidence of whether your adaptive design is truly working.
Permissions, Data Access, and Organization Layer
Content Engagement Analytics is governed by role-based permissions and the organization layer. Users can only see data they are authorized to access based on their role, organizational affiliation, and scope of responsibility.
In practice:
- Data visibility is limited to permitted organizations, activities, and entities
- Parent organizations can see aggregated sub-organization data; sub-organizations cannot see upward or sideways
- Blocked users remain visible for historical accuracy; deleted users are excluded for privacy compliance; Cancelled and expired enrollments remain visible for audit and traceability
- The same rules apply consistently to both on-screen analytics and exported reports
This ensures secure, consistent, and audit-ready access to data across the platform.
Pragmatic Design Checklist
In learning design, there are many established frameworks—such as ADDIE and others—each tailored to different audiences, disciplines, learning contexts, and learner maturity levels. While these frameworks provide comprehensive guidance, the following tips focus specifically on how content engagement analytics can be used as practical reference points when evaluating and refining learning design decisions, regardless of the framework you follow.
Here’s a clean, easy-to-scan table version that works well as a practical checklist in a knowledge base article:
| Phase | Key Questions and Actions |
|---|---|
| Before Reviewing Analytics |
|
| While Reviewing Engagement Data |
|
| After Identifying Patterns |
|
Use engagement analytics iteratively. Small design adjustments followed by re-analysis often produce better results than large, one-off redesigns.
Merrill’s First Principles → Content Engagement Analytics
Content Engagement Analytics aligns closely with established instructional design frameworks such as Merrill’s First Principles of Instruction. This model is widely recognized because it is easy to understand, highly actionable, and grounded in learning science rather than tied to any specific technology, delivery format, or era. As a result, these principles continue to appear—explicitly or implicitly—in modern learning design, adaptive learning strategies, and data-driven learning platforms.
By examining how learners engage with content across problem framing, activation, demonstration, application, and integration, we can move beyond surface-level metrics. Content engagement data makes it possible to evaluate whether learning design decisions are actually supporting meaningful understanding, effective knowledge transfer, and real-world application—not just completion.
| Merrill Principle | Relevant Content Engagement Metrics | What Patterns May Indicate | How to Act on the Insight |
|---|---|---|---|
| Problem-Centered |
| Low views or fast skipping may signal low relevance or unclear context | Strengthen real-world framing, add clearer “why this matters”, or contextualize the problem to the learner’s role |
| Activation |
| Low engagement here combined with later struggles suggests learners are not primed | Add clearer prerequisites, short refreshers, or quick diagnostic questions |
| Demonstration |
| High replays or early drop-off may indicate unclear or overloaded demonstrations | Shorten demonstrations, split content, or add step-by-step examples |
| Application |
| Many retries with drop-off suggests frustration; retries with improvement indicate productive struggle |
|
| Integration |
| Completion without engagement here suggests shallow learning | Add reflection prompts, workplace scenarios, or follow-on challenges |
The five principles in short: Learning starts with real-world problems learners care about → Learners connect new knowledge prior experience → New concepts are shown before being practiced → Learners practice and apply what they learned → Learners reflect, transfer, and apply learning to their context.
Real-World Scenarios
Below are common scenarios that show how organizations use engagement data to improve learning effectiveness, learner experience, and business outcomes.
Scenario 1: Improving Customer Onboarding for a Complex Product
Context: A software company delivers self-paced onboarding courses for customers across multiple regions. Completion rates are acceptable, but support tickets remain high in the first 90 days.
| What Engagement Analytics Reveals | How Teams Act | Outcome |
|---|---|---|
|
|
|
Scenario 2: Optimizing Instructor-Led Training Preparation
Context: An organization delivers instructor-led workshops supported by pre-work content. Attendance is strong, but live sessions repeatedly cover basic topics that should already be known.
| What Engagement Analytics Reveals | How Teams Act | Outcome |
|---|---|---|
|
|
|
Scenario 3: Partner Enablement Across Regions
Context: A global company delivers partner training in multiple languages and regions, using the same core learning objects.
| What Engagement Analytics Reveals | How Teams Act | Outcome |
|---|---|---|
|
|
|
Scenario 4: Continuous Improvement for Compliance and Risk Training
Context: An organization runs mandatory compliance training annually and must demonstrate ongoing improvement to auditors.
| What Engagement Analytics Reveals | How Teams Act | Outcome |
|---|---|---|
|
|
|
Scenario 5: Data-Driven Content Investment Decisions
Context: A learning organization must decide where to invest next: more videos, interactive content, or assessments.
| What Engagement Analytics Reveals | How Teams Act | Outcome |
|---|---|---|
|
|
|
Persona-Based Guidance: How Different Roles Should Use Content Engagement Analytics
Content Engagement Analytics supports multiple stakeholders across the learning organization, each with different responsibilities, decision horizons, and levels of involvement. Knowing what to look for—and how to interpret it—is essential to turning data into informed action rather than background noise.
Not every role needs direct access to engagement analytics. In many cases, insights are shared through reports, design reviews, or feedback loops that inform improvements in content, delivery, or learner support. When used this way, engagement data becomes a collaborative input that helps align learning design, instructional decisions, and business outcomes—without overwhelming users with unnecessary detail.
Platform & Course Administrators
Administrators typically focus on portfolio health and scalability.
They use content engagement analytics to:
- Identify underperforming content objects across courses and programs
- Detect systematic drop-off patterns tied to specific formats or objects
- Compare engagement across organizations, regions, or customer segments
- Validate whether adaptive strategies are functioning as intended at scale
For administrators, engagement data helps answer:
“Is our learning ecosystem working as designed across audiences?”
Instructional Designers & Learning Architects
Designers use engagement analytics as a feedback loop for learning design quality.
They focus on:
- Time spent vs. intended effort per object
- Objects that are repeatedly revisited or skipped
- Correlation between engagement and downstream outcomes (progress, certification)
- Whether adaptive modules are triggered appropriately — not too often, not too rarely
For designers, the core question becomes:
“Does this content structure support efficient, relevant learning for different competence levels?”
This enables evidence-based decisions instead of subjective assumptions.
Instructors & Subject Matter Experts (if applicable)
Instructors use engagement data to validate pedagogy and learner behavior.
They typically analyze:
- Which explanations, examples, or demonstrations learners return to
- Where learners disengage before live sessions or assessments
- Whether preparatory materials are actually consumed before instructor-led activities
This helps instructors:
- Adjust emphasis in live sessions
- Refine explanations where engagement signals confusion
- Create targeted follow-up content or discussions
Management, Managers & Program Owners
Managers look at engagement data as a leading indicator of adoption and effectiveness.
They focus on:
- Whether learners engage meaningfully, not just enroll
- Differences in engagement across teams or partners
- Early warning signs before completion or certification issues appear
For managers, engagement answers:
“Are people actually using what we invest in — and where should we intervene early?”
Common Red Flags in Content Engagement Analytics
Avoid reacting to a single metric. Patterns become meaningful when viewed across time, audiences, and outcomes. Below are common patterns and what they typically indicate.
| Engagement Pattern | Likely Interpretation | Recommended Action |
|---|---|---|
| High enrollments, low object engagement | Content is perceived as optional or irrelevant | Clarify value, reposition object, or integrate it into assessments |
| Long average time on a short page | Content may be confusing or overly dense | Simplify language, add examples, or split content |
| Video engagement drops consistently at the same timestamp | Video is too long or key point is too late | Edit or front-load the core message |
| Frequent revisits to the same object | Learners rely on it as a reference | Consider adding a summary, confirm assumption on repeated revisits |
| Adaptive remediation rarely triggered | Thresholds may be too lenient | Review assessment design |
| Adaptive remediation triggered excessively | Thresholds may be too strict or unclear | Adjust logic or improve primary content |
| Strong engagement but poor completion | Structural issues in course flow | Review prerequisites, navigation, or pacing |
| Engagement varies widely by organization | Contextual relevance differs | Localize examples or segment content |
Governance & Audit Perspective
From a governance and audit perspective, Content Engagement Analytics provides evidence that learning is not only assigned, but meaningfully consumed. In regulated industries such as healthcare, energy, finance, or manufacturing, this supports proof that mandatory procedures, safety materials, or compliance content were actually accessed and engaged with—not just marked as complete.
When combined with attendance, progress, and certification data, engagement metrics strengthen audit trails by showing how long learners interacted with critical content, which materials were revisited, and where engagement may have dropped. This enables organizations to demonstrate due diligence, validate learning effectiveness, and support defensible reporting for regulatory audits, accreditations, and internal quality reviews—well beyond basic completion statistics.