NPS Analytics and Reporting - Article
Summary
Net Promoter Score (NPS) helps you understand how willing respondents are to recommend a training experience, service or relationship. Analytics → NPS brings responses from the NPS questionnaire question type together, making it possible to review overall sentiment and compare relevant contexts over time.
Use the score to identify where a conversation or investigation is needed—not as proof of learning, competence or commercial success. The question asked, collection point, response count and audience all influence what the result can reasonably tell you.
Use this article to:
- Choose a meaningful transactional or relationship-level use of NPS
- Read the score, response distribution and collection coverage
- Apply filters without mixing unrelated questions or audiences
- Understand role scope, anonymized answers and organization attribution
- Find the response-level evidence for investigation and reporting
Decide what relationship you want to measure
For transactional NPS, ask about a defined experience at a useful moment—for example, after a particular workshop. For relationship-level NPS, ask about the academy or service as a whole through an appropriate recurring or general questionnaire route.
These are different questions. Someone can value an ongoing subscription yet dislike one session, or enjoy a course without wanting to recommend the wider service. Do not combine those answers into a single interpretation simply because the platform can aggregate them.
Example: “How likely are you to recommend this training to a colleague or peer?” is suitable for a specific learning experience. “How likely are you to recommend our service academy to another organization?” asks about a broader relationship. Keep the wording, timing and audience sufficiently consistent when comparing results.
Use an optional follow-up question to understand the reason for the score. A short explanation can help distinguish a content problem from access difficulties, expectations, scheduling or facilitation. Do not ask repeatedly on every page when the additional effort will reduce the quality or volume of feedback.
Collect the NPS question type
Create or edit a questionnaire under Course administration → Questionnaires, use Add question → NPS, and enter the question. Add useful help text and choose whether a response is required. Preview it before use.
The current NPS response control runs from 0 to 10, from not likely at all to extremely likely. A generic Number, Linear scale or Rating scale question that looks similar is not the same question type and does not automatically become an NPS answer in this report.
The questionnaire can be used through supported routes such as activity feedback, a course questionnaire button, onboarding rules or a generated questionnaire URL. Choose the collection route to match the measurement purpose and the intended access/anonymization configuration. This report summarizes NPS data; it does not itself distribute the questionnaire.
Open the report within your permitted scope
Open Analytics → NPS. Access depends on Settings → Analytics permissions, the user's role and the applicable data relationship. Enabling a report page does not automatically give that role every response on the platform.
Administrative scope can be affected by organization governance. Instructors see the relevant feedback or course-button questionnaire responses for activities where they are responsible. Manager-like roles have the documented enrollment-request and approval relationships rather than automatically seeing all course feedback from everyone they supervise. Participant and Trial roles do not have this analytics view.
If a customer contact cannot see the expected data, check the report permission and response relationship separately. Do not broaden their system role merely to make a chart appear. Introduction and Basic Configuration explains the wider analytics approach.
Read the score and its denominator
The score is the percentage of Promoter answers minus the percentage of Detractor answers. It ranges from −100 to +100; it is not an average rating out of ten or a completion percentage.
| Answer group | Scores | Contribution to NPS |
|---|---|---|
| Promoters | 9–10 | Included in the positive percentage |
| Passives | 7–8 | Included in the total answer count, but not subtracted or added directly |
| Detractors | 0–6 | Included in the negative percentage |
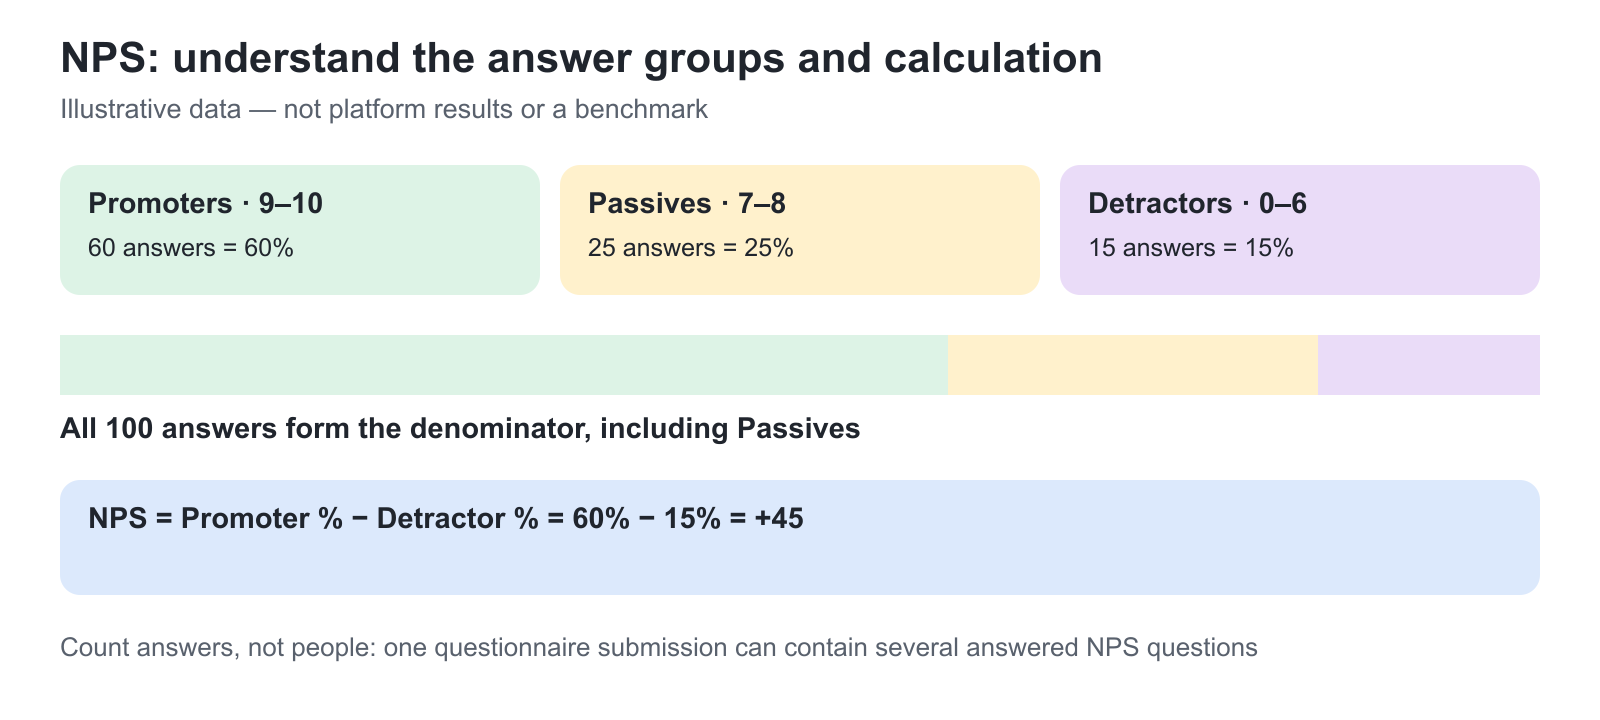
Illustrative calculation: With 100 NPS answers, 60 Promoters, 25 Passives and 15 Detractors, NPS is 60% − 15% = +45. Passives remain in the denominator. Removing them from the total would calculate a different result.
The unit is an NPS answer, not necessarily a unique person or one completed questionnaire. A submission containing four answered NPS questions contributes four NPS answers. Repeated submissions can also represent more than one answer from a person. This matters when explaining a large response count or comparing questionnaires with different numbers of NPS questions.
Understand the dashboard elements
| Element | What it tells you | Interpretation boundary |
|---|---|---|
| Score | NPS for the selected data | Not a learning result, average rating or revenue measure |
| Answers | The number of included NPS question answers | Not necessarily unique respondents or completed questionnaires |
| Used in | Places where a questionnaire containing NPS is attached | A collection point can be counted before anyone has answered there; available to the appropriate administrative scope |
| Answer distribution | Counts and percentages of Promoters, Passives and Detractors | Two groups can have the same net score but different response patterns |
| Trend | NPS over time grouped by questionnaire-use context | Check whether the audience, question and collection method stayed comparable |
| Organization breakdown | The result attributed to current organizational membership | Not necessarily the organization at the time the answer was submitted |
Where available, Used in opens the relevant collection locations. Use it to check coverage, not as a response-rate calculation. The dashboard does not establish the number of people invited simply from the number of collection points.
Filter before drawing a conclusion
Set From and To first. The default range is the first day of the current month through today, and it filters by the questionnaire's submission time—not the training's start or completion date. Use Reset to return the date controls to their defaults when needed.
Available filters include training type, activity, organizations, questionnaires and Used in. Their availability and choices follow the role's scope. Administrative users can also use Respondent type to distinguish All, Registered and Unregistered respondents.
Start with a question you can act on: “Did the revised workshop improve the recommendation sentiment for the same audience?” Filter to the relevant activity/questionnaire and compare suitable periods. Inspect the answer count and distribution before treating a change as meaningful.
An unfiltered platform result can combine several unrelated purposes. It is useful as a broad signal only when you understand what is being aggregated. Adding a new survey, changing a question or inviting a different audience can alter the result without proving that the existing learning service improved or deteriorated.
Account for anonymity and changing organizations
Anonymized NPS responses can contribute to aggregate results even when they cannot be attributed to a named user. Responses anonymized through the questionnaire's configured rules are treated in the Unregistered respondent category. They do not provide the same user-level or organization breakdown as identifiable responses.
Consequently, an overall total need not equal the sum of named-user or organization-specific views. Do not attempt to reverse that design by combining filters to identify an anonymous respondent. Review the questionnaire's anonymization rules and explain the reporting limitations before collecting feedback.
Organization attribution follows the respondent's current membership. Moving a person to another organization can change the organization breakdown for their earlier answers. If a historical organizational comparison must be reproducible, record the reporting date, filters and relevant organizational context alongside the approved export or analysis.
Blocked users and canceled or expired participation can still contribute answers. Deleted users and deleted questionnaires are excluded from this analytics view. Changes to those records can therefore affect later comparisons; a report is not necessarily a permanently frozen historical snapshot.
Investigate through Questionnaires analytics and reports
Use Analytics → Questionnaires for the existing questionnaire-level analysis and downloadable response reports. NPS is included in the relevant question breakdown there. Do not assume the aggregate NPS dashboard offers an independent export of every chart or a complete named-respondent list.
Use the relevant questionnaire filters and permitted response detail to investigate an issue. A follow-up comment can explain why a respondent selected a score, while participation and learning-performance reports answer different questions about progress and achievement. See Questionnaires Analytics and Report.
Worked example: a positive total can hide a weak experience
Imagine two training groups use the same recommendation question over a comparable period, with one NPS answer per submission. The partner technical update receives 80 answers and NPS +60. Customer foundation training receives 20 answers and NPS −40. These are fictional examples, not platform results or benchmarks.
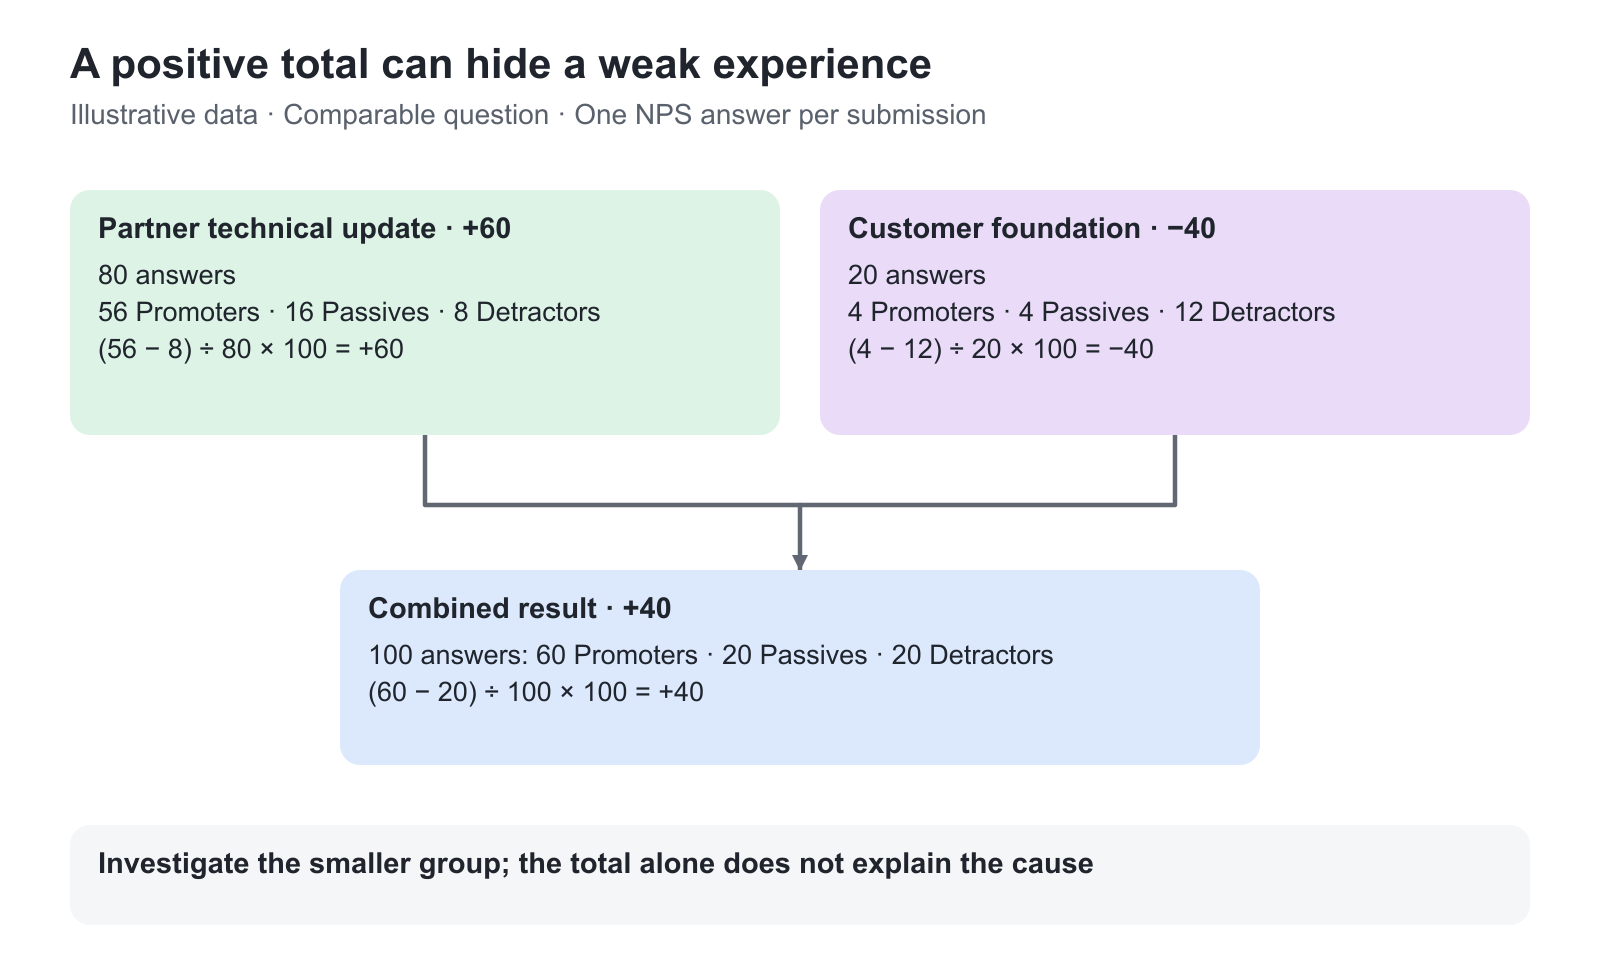
Pooling the 100 answers gives +40, which could look reassuring in an overall review. It does not remove the need to investigate the weaker customer experience. The two scores must not simply be averaged: their answer counts differ. Use the relevant activity and questionnaire filters to examine each context before drawing a conclusion.
In this example, the foundation group's optional comments might reveal that the content assumes installation experience that new customers do not yet have. A useful response could be to improve the starting guidance or add a genuinely introductory activity. If the comments instead concern finding the included training, the first improvement may belong in member onboarding or Storefront presentation rather than in the technical lesson.
For a commercial academy, take that distinction into a customer or renewal conversation: what did people need, where did the experience fail to meet that need, and what will change? Agree an owner for the improvement, then compare a suitable later group using consistent wording and collection timing. A better score can support that conversation; it does not itself prove revenue growth, renewed contracts or competence.
Turn the result into an appropriate action
A negative score means Detractor answers outweigh Promoter answers in the selected data. A positive score means the reverse. Neither establishes the cause, and a small or changing sample can make comparisons unstable.
For content developers, a repeated low result in one activity can justify reviewing clarity, usefulness or delivery. For a customer academy, relationship-level sentiment can inform a service review or renewal conversation. Pair the score with the actual comments and usage context rather than assuming low participation, poor competence and dissatisfaction are the same problem.
Choose a proportionate follow-up: revise an unclear section, discuss expectations with a customer group, improve facilitation or investigate an access issue. State what you changed and compare a suitable later period. Do not use the score as an automatic decision about a person's eligibility, performance or customer value.
Verify the collection and interpretation
Before using the result in a content or customer review, confirm that the data answers the question you intended to ask. Use permitted response detail without trying to identify anonymized respondents.
| Check | Expected result or evidence |
|---|---|
| Inspect the source question and a submitted response | The questionnaire uses the NPS question type and the submission falls within the selected From/To range |
| Review the answer count before comparing scores | The denominator reflects answered NPS questions, including multiple questions or submissions where applicable, rather than an assumed count of unique people |
| Investigate the same context in Questionnaires analytics | The selected questionnaire, period and permitted response scope explain the result and provide available follow-up answers; an aggregate score alone has not been treated as its cause |
| Repeat a later comparison | Question wording, collection purpose, audience and filters are sufficiently comparable, with organizational changes or anonymization differences documented where they affect interpretation |
Troubleshooting
| Problem | What to check |
|---|---|
| No NPS data appears | Check the date range, actual submitted NPS question type, filters and permitted response scope |
| Answers exceeds the number of questionnaires | Each answered NPS question counts separately; one submission can contribute several answers |
| The score differs from an average rating | NPS subtracts Detractor percentage from Promoter percentage; it does not average 0–10 ratings |
| Used in is nonzero but Answers is zero | Collection locations can exist before responses are submitted |
| Used in or respondent filters are absent | Check the role-specific controls and scope rather than assuming the page is broken |
| The total differs from organization charts | Check anonymous/anonymized responses, current membership and organization filters |
| A past organization's result changed | Attribution follows current user membership rather than membership at submission |
| Data disappeared after cleanup | Deleted users and questionnaires are excluded; review authorized retention or deletion actions |
| A manager cannot see general learner feedback | Review the documented approval/request relationships and analytics permissions |
| A downloadable NPS chart report is not available | Use the relevant Questionnaires analytics/report route for response-level exports |
FAQ
-
Why can NPS Answers exceed the number of questionnaire submissions?
Each answered NPS question counts as an NPS answer. A single submitted questionnaire containing four answered NPS questions contributes four answers, and repeated submissions can contribute more than one answer from the same person. Answers is not a unique-respondent count.
-
Why can NPS totals differ from the organization breakdown?
Aggregate results can include anonymous or anonymized responses that cannot be attributed to the same user or organization filters. Identifiable organization attribution also follows current membership, not necessarily membership at submission. Check the date range, filters, anonymization rules and role scope before comparing totals.
-
Where can I download the response-level evidence behind NPS?
Use the relevant Analytics → Questionnaires analysis and report route. The NPS dashboard summarizes the selected data; do not assume it provides a separate export of every chart or an unrestricted named-respondent list. Exports still follow the permitted scope and applicable anonymization.